Dashboard Metrics


Tardy Rate
Background
Student Dashboard Metrics
Especially in lower grades where attendance is taken only once a day, tardy rate is a key indicator of student success, much along the lines of class period attendance for high school and middle school. Moreover, in stakeholder meetings with over 2,600 educators, tardy rate was repeatedly called out as a need for elementary students.
Primary Metric
- Tardy Rate: percent of days a student is tardy during the last four weeks, last eight weeks and entire year to date with comparison to campus goal for each.
User Interface
Dashboard Example
Figure 1 shows the Tardy Rate metric as seen on the student dashboard.
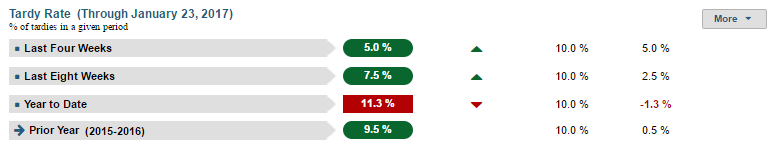
Figure 1 TSDS Tardy Rate Metric
Status Definition
The Status Indicator is determined by campus-specific thresholds (student goals) which are set at the district level. The default tardy thresholds set in the dashboards are:
- Last Four Weeks and Last Eight Weeks – 10% (2 days in 4 weeks, 4 days in 8 weeks)
- Year to Date – 10% (number of eligible days * 10% for YTD)
The Tardy Rate is defined by using the last 4 and 8 weeks; it is actually based on the last 20 and 40 academic days respectively.
Table 2 lists the status indicators and trend comparisons for the Tardy Rate metric as seen on the student dashboard.
Metric Indicator | Trend Comparisons | |||
Metric Name | Sub-metric Name | Metric Status Indicator | Compares: | To: |
Tardy Rate | Last Four Weeks | Red (Percentage) = if Tardy Rate is greater than or equal to campus goal Green (Percentage) = if Tardy Rate is less than campus goal | Begins 40 days into school year, no overlapping dates Current four weeks | Prior four weeks |
Last Eight Weeks | Red (Percentage) = if Tardy Rate is greater than or equal to campus goal Green (Percentage) = if Tardy Rate is less than campus goal | Begins 80 days into school year, no overlapping dates Current eight weeks | Prior eight weeks | |
Year to Date | Red (Percentage) = if Tardy Rate is greater than or equal to campus goal Green (Percentage) = if Tardy Rate is less than campus goal | Current year | Prior year | |
(a) The Value column displays the percentage of the period the student was tardy.
Trend Definition
Table 3 lists the trend indicators for the Tardy Rate metric.
Trend Indicators: Objective is to indicate Tardy Rate | |||
| Up green | If the value for the current time frame is more than the 5 percentage points lower than the prior time frame | |
| Unchanged | If the value for the current time frame is less than or equal to 5 percentage points higher or less than or equal to 5 percentage points lower than the prior time frame | |
| Down red | If the value for the current time frame is more than 5 percentage points higher than the prior time frame | |
The trend does not display if the data is for the first occurrence of the time frame since data is not available.
Delta Definition
Delta Indicators: Objective is to indicate Tardy Rate | |||
Metric Name | Sub-Metric Name | Campus Goal | Delta |
Tardy Rate | Last Four Weeks | Set Student Goal | Red (Percentage) = if the calculated delta is less than the campus goal Black (Percentage) = if the calculated delta is equal to or greater than the campus goal |
Last Eight Weeks | Set Student Goal | Red (Percentage) = if the calculated delta is less than the campus goal Black (Percentage) = if the calculated delta is equal to or greater than the campus goal | |
Year to Date | Set Student Goal | Red (Percentage) = if the calculated delta is less than the campus goal Black (Percentage) = if the calculated delta is equal to or greater than the campus goal | |
Periodicity
Best practice is to load the data for this metric daily.
Recommended Load Characteristics | |
Calendar | Throughout the school year |
Frequency of data load | Daily, Weekly, Monthly |
Latency | 4 weeks |
Interchange schema | Interchange-StudentAttendance.xsd |
Tooltips
The standard tool tips for the metric definition, column headers, and help functions display for this metric.
The following are tooltips specific to the Tardy Rate metric:
- Green metrics status: OK
- Red metric status: HIGH
- 'More' indicates that there are drill down views for this metric
 is 'No change from prior period.'
 is ‘Getting better from prior period.'
 is ‘Getting worse from prior period.'
Business Rules
The Tardy Rate metric displays the percentage of instructional days a student is tardy for the following time frames:
- Last Four Weeks
- Last Eight Weeks
- Year to Date
- Prior Year
Data Assumptions
- Campus must record student tardies at the classroom level for each time frame.
- The class or period when tardy is counted must be specified.
- Student tardy reasons are recorded.
- District sets the value that drives the campus and student status thresholds.
Computed Values
When calculating this metric, the following additional rules apply:
- A tardy or early release (if captured) is not counted as an absence
- Days the student is not enrolled are subtracted from total instructional days
The length of the time frames is configurable and is defined by the district.
Table 5 defines how values are calculated. The result of the calculation displays in the Status column and Value on the student dashboard.
Metric Values | ||
Tardy Rate | Last Four Weeks | Percentage = Total number of days student is tardy / Number of instructional days in 20 academic days |
Last Eight Weeks | Percentage = Total number of days student is tardy / Number of Instructional days in 40 academic days | |
Year to Date | Percentage = Total number of days student is tardy / (Number of instructional days in year to date) * 100 | |
| Prior Year | Year to Date Tardy Rate as of the final instructional date from the prior year | |
Calculation Notes
- Days a student is not enrolled are subtracted from the “Total Number of Instructional Days” in the denominator.
Data Anomalies
Data Anomalies
- Metrics are sensitive to when and how often the data is loaded.
- Late enrollees are likely to be missing attendance data.This calculation is not dynamic, and currently students will be presumed present for all days prior to enrollment. Detail view of tardy rate will have more options.
- If the school calendar changes, then adjust the denominator to reflect eligible days.
- Create an icon (not implement) that shows if last data load was more than a month ago.
Best practice is to use footnotes to address these anomalies.
Footnotes
Footnotes are used to provide addition data information concerning the metric. Footnotes are sequential for the entire page. Therefore, a metric's footnote may not begin with the number 1.
The following footnotes appear below the metric:
- Best practice is to footnote students transferring in that have not been present for a full time frame.
- Metrics are sensitive to when and how often the data is loaded.
- Late enrollees are likely to be missing tardy data.
Date of Refresh
Best practice is for the date of last data refresh to appear next the metric in the following format:
- (Through April 22, 2010)
Implementation Considerations
Attendance and Grade Metrics for Elementary Students
TSDS uses a student's assignment to formal class periods to determine both attendance and grades. Most elementary schools do not have a standard methodology for capturing attendance data, including tardy rate. A teacher may take attendance in the classroom, but not formally record it. The same is true for grades, especially in kindergarten and first grade. In most cases, TSDS metrics will not display attendance data for these grade levels and grades may not display in the metrics until the end of the year, if at all.
Late enrollments
For late enrollment students, the number of instructional days in a time frame requires adjustment. Specifically, subtract the days the student was not enrolled from the number of instructional days in the time frame (e.g., last 4 weeks, last 8 weeks, or year-to-date).
Classification of Days as Non-Instructional Days
For the computation of the number of instructional days, use the total count of instructional days in a time frame or utilize the school calendar to identify specific instructional days as the denominator for the percentage. The latter is a more accurate approach to calculating the metric with the caveat that this requires frequent uploading of data throughout the school year.
Frequency of Uploading Data
The metric computation implementation may vary depending on the periodicity of loading the data. For example, a daily load requires that you load data only for a single day (i.e., the last instructional day). Less frequent uploads require that you load data for each day since the date of the last load.
Trend
The metric assumes that only the current year’s tardy data is loaded. In this case, if the current time frame is the first occurrence of the
- Last 4 weeks, there is no trend for current last 4 weeks and no trend for previous last 4 weeks
- Last 8 weeks, there is no trend for the previous last 8 weeks
If the previous year’s tardy data is loaded, developers have the the option to compare current year to the previous year’s time frames.
Best practice is for the district to establish a precision policy of what determines no change (e.g., ±5 percentage points).
Thresholds
The student threshold for this metric is 10% of instructional days in the specified period.
Drill Downs
Drill Down Views
The dashboards include the option to drill down and see more detail that is associated with a metric. Table 6 lists the drill down views that are recommended for this metric.
| Calendar | Absences and Tardies Calendar | |
| Historical | Graph of metric values compared across daily, weekly, grading period, semester, and yearly timeframes. |
User Interface Notes
Dashboard Example
Figure 2 shows the calendar of absences and tardies
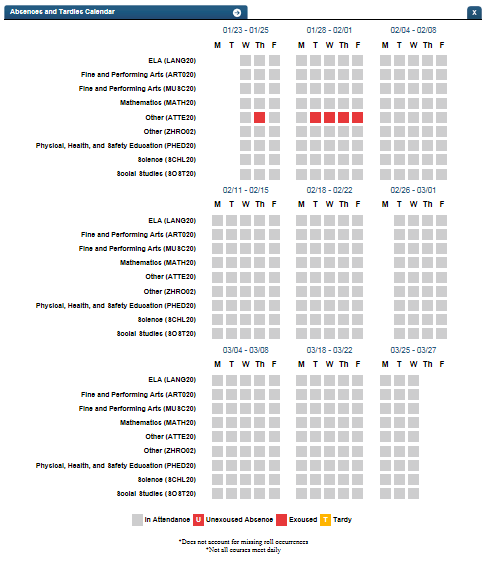
Figure 2 TSDS Absences and Tardies Calendar
Figure 3 shows the Historical Chart by time periods.
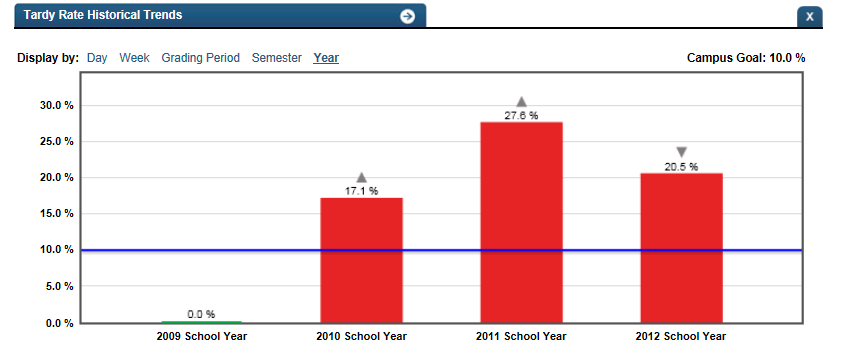
Figure 3 TSDS Tardy Rate Historical Chart
Drill down tooltips
Absences and Tardies Calendar:
- The date is shown as you hover over a specific period when a student is present.
- The date and the reason for an excused absence is shown as you hover over a specific day's excused absence on the calendar.
- 'Unexcused absence on (date)' is shown as you hover over an unexcused absence.
- 'Tardy on (date)' is shown as you hover over a tardy.
- The calendar does not account for missing roll
- Not all courses meet every day.
Historical Chart:
- The start and end dates and the percent value of the metric for that time period are shown as you hover over a bar of the graph.
- The slider bar adjusts the number of time periods viewed in the graph.
- Green bar indicates the student did meet the student goal
- Red bar indicates the student did not meet the student goal
Business Rules
The default view of classroom absences by subject is recommended because
- viewing period absences by a particular subject enables you to directly tie data to performance issues in that subject
- not every class meets daily, making it difficult to display period absences by time of day
The visualization shows a set of weekly matrices for a time frame. Each column is labeled with a day of the week. Each row is labeled with a subject. Because the intent is to examine class absences by subject, the visualization may or may not order the classes by time of day.
Individual class period absences are displayed in red. Those that are unexcused display with a 'U'. If a reason was captured for an excused absence, it is shown in a tooltip as you hover over the excused absence.
Individual class period tardies are displayed in yellow with a 'T'.
Non-instructional days per subject are blacked out in the following circumstances:
- If a class period does not meet on a specific day
- If the day is a non-instructional day (e.g., holiday)
- For days the student is not enrolled
- For class periods missed because of delayed start or early release
The Historical Graph allows the user to see historical data across multiple timeframes. As time passes, there are many bars to be displayed; therefore, the slider on the bottom allows the user to adjust the number of bars displayed as well as the time period shown. The timeframes for this metric were chosen based on educator feedback.