Dashboard Metrics


Teacher Education
Background
Campus Dashboard Metrics
The education of teachers is an important part of their training. Ensuring that all teachers have at least a bachelor's degree is an important part of any staffing decisions.
Primary Metric
- Teacher Education: percentage of teachers holding better than a bachelor's degree.
User Interface
Dashboard Example
Figure 1 shows the Teacher Education metric as seen on the staff dashboard.

Figure 1 TSDS Teacher Education
Status Definition
The Status indicator is determined by campus-specific thresholds (campus goals) which are set at the district level. The TSDS default threshold is 90% for Bachelor's degree and 30% for Masters Degree.
Metric Indicator | Comparisons | |||
Metric Name | Sub-metric Name | Metric Indicator | Trend | Campus Goal (Delta) |
Teacher Education | Bachelor's Masters or Doctorate | Red (Percentage) = teachers with education level less than campus goal Green (Percentage = teachers with education level equal to or greater than campus goal | Current and prior year | Campus goal and the calculated Teacher Education |
Trend Definition
The objective of Trends is to increase the number of teachers with advanced degrees.
Table 3 lists the trend indicators for the Teacher Education metric. For Phase 2, the trend indicators are gray; this table is for documentation purposes.
Trend Indicators for Teacher Education | |||
| Up green | Percentage is higher compared to previous time frame; upward trend is favorable | |
| Unchanged | + 5 percentage points | |
| Down red | Percentage is lower compared to previous time frame; flag indicates unfavorable trend | |
Delta Definition
The Delta column is the absolute value of the difference between the campus attendance percentage (Status column) and the campus goal (Campus Goal column). If the attendance percentage is below the campus goal, the delta percentage is displayed in red. If the attendance percentage is equal to or above the campus goal, the delta percentage is displayed in black.
Periodicity
Best practice is to load the data for this metric each semester.
Recommended Load Characteristics | |
Calendar | Throughout the school year |
Frequency of data load | Yearly, Semester (to account for teacher turnover) |
Latency | Year |
Interchange schema | Interchange-StaffAssociation.xsd |
Tooltips
The standard tool tips for the metric definition, column headers, and help functions display for this metric.
The following are tooltips specific to the Teacher Education metric:
- Green metric status: OK
- Red metric status: LOW
- 'More' indicates drill down views for this metric
 is ‘No change from the prior period'
 is ‘Getting worse from the prior period’
 is 'Getting better from the prior period'
Business Rules
The Teacher Education metric displays the percentage of teachers with advanced education. This includes bachelors and masters or doctorate degrees.
Data Assumptions
- Data is available in district source systems.
Computed Values
Table 5 defines how values are calculated for each sub-metric. The result of the calculation displays in the Status column on the staff dashboard.
Metric Values | ||
Teacher Education | Bachelor | Total number of teachers at campus with bachelor's degree (including teachers with masters and doctorate) / Total number of teachers currently teaching at campus |
Masters or Doctorate | Total number of teachers at campus with masters and/or doctorate degree / Total number of teachers currently teaching at campus | |
Data Anomalies
Data Anomalies
- The date of refresh for teacher metrics differ slightly by campus. This is due to the last date of hire for each campus being different.
- If a campus does not have teachers in a subject area, the denominator for this metric may appear different than in other subject areas.
- Teachers are designated as such in the teacher metrics and teacher list only if they have a section assigned to them.
Date of Refresh
Best practice is for the date of last data refresh to appear next the metric in the following format:
- (Through April 2010)
Footnotes
Footnotes are used to provide addition data information concerning the metric.
The following footnotes appear below the metric:
- This metric includes only teachers currently teaching at a campus.
Date of Refresh
Best practice is for the date of last data refresh to appear next the metric in the following format:
- (Through April 2010)
Implementation Considerations
Teacher Education
This metric was created to help ensure that all teachers have at minimum a bachelors degree and should be an important part of any staffing decisions.
This metric displays the percentage of teachers holding master's or doctorate degree.
Drill Downs
Drill Down Views
The dashboards include the option to drill down and see more detail that is associated with a metric. Table 6 lists the drill down views that are defined for this metric.
| Historical | Historical metric values across multiple time periods. | |
| Teacher List | List of teachers who do not meet the threshold for this metric for the specified period. |
User Interface
Dashboard Example
Figure 2 shows the teacher list for the Teacher Education metric as seen in the operational dashboard.
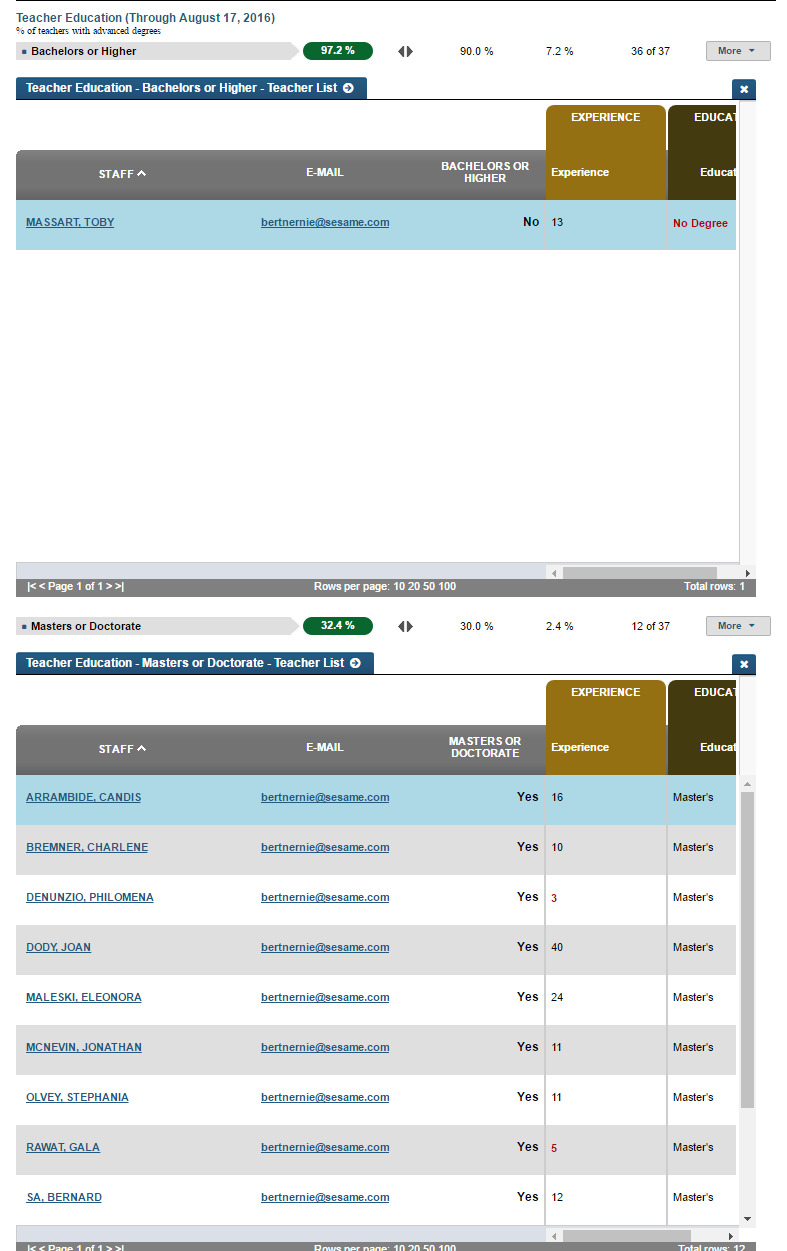
Figure 2 TSDS Teacher Education List
Figure 3 shows the historical chart for the Teacher Education metric as seen in the operational dashboard.

Figure 3 TSDS Teacher Education Historical Chart