Dashboard Metrics


TELPAS
Background
Campus Dashboard Metrics
English Language Learners (ELL) are an important and large segment of the school aged population. The English Language Learner metrics indicates Texas English Language Proficiency Assessment Systems (TELPAS) scores and corresponding language levels for ELL students. Moreover, in focus groups with over 2,600 Texas educators, the English Language Learner metric was repeatedly called out as necessary for classroom educators.
This metric appears for campuses serving students in grades 6-12.
Primary Metric
- TELPAS: percentage of students at each of the four TELPAS proficiency levels. For a definition of the proficiency levels and acronyms, see the Appendix on this page.
User Interface
Dashboard Example
Figure 1 shows the TELPAS metric as seen on the campus dashboard.
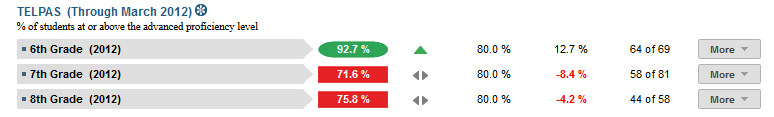
Figure 1 TSDS TELPAS Metric at the Middle School Level
Figure 2 shows the TELPAS metric as seen on the campus dashboard.
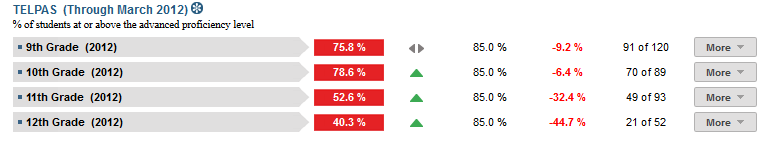
Figure 2 TSDS TELPAS Metric at the High School Level
Status Definition
The Status column displays the percentage of students who achieve an Advanced level of proficiency by grade level (either 6th, 7th and 8th grades for middle school or 9th, 10th, 11th and 12th grades for high school). For a definition of each proficiency level, see the Appendix for this metric.
The Status indicator is determined by campus-specific thresholds (campus goals) for each grade level which are set at the district level. The TSDS default threshold is 85% of students taking the test for each grade level achieving an Advanced level of proficiency.
Metric Indicator | Trend Comparisons | |||
Metric Name | Sub-metric Name | Metric Status Indicator | Trend | Campus Goal (Delta) |
TELPAS | 6th Grade OR 9th Grade | Red (Percentage) = if percentage of students at or above advanced proficiency level is less than campus goal Green (Percentage) if percentage of students at or above advanced proficiency level is greater than or equal to campus goal | Currrent year to prior year | Campus goal and the calculated percentage of students at or above advanced proficiency level |
7th Grade OR 10th Grade | Red (Percentage) = if percentage of students at or above advanced proficiency level is less than campus goal Green (Percentage) if percentage of students at or above advanced proficiency level is greater than or equal to campus goal | Currrent year to prior year | Campus goal and the calculated percentage of students at or above advanced proficiency level | |
8th Grade OR 11th grade | Red (Percentage) = if percentage of students at or above advanced proficiency level is less than campus goal Green (Percentage) if percentage of students at or above advanced proficiency level is greater than or equal to campus goal | Currrent year to prior year | Campus goal and the calculated percentage of students at or above advanced proficiency level | |
12th Grade | Red (Percentage) = if percentage of students at or above advanced proficiency level is less than campus goal Green (Percentage) if percentage of students at or above advanced proficiency level is greater than or equal to campus goal | Currrent year to prior year | Campus goal and the calculated percentage of students at or above advanced proficiency level | |
(a) The Value column displays the number of students at or above the advanced proficiency level out of the total number of students who took TELPAS.
Trend Definition
Trend Indicators: Objective is to indicate TELPAS | |||
| Up green | If the value for the current time frame is more than 5 percentage points higher than the prior time frame, then display a gray arrow trending upward. | |
| Unchanged | If the value for the current time frame is less than or equal to 5 percentage points higher or less than or equal to 5 percentage points lower than the prior time frame, then display two gray arrows pointing outward indicating no direction. | |
| Down red | If the value for the current time frame is more than 5 percentage points lower than the prior time frame, then display a gray arrow trending downward. | |
The trend does not show for the first occurrence of a time frame since data is not available.
Delta Definition
Delta Indicators: Objective is to indicate TELPAS | |||
Metric Name | Sub-Metric Name | Campus Goal | Delta |
TELPAS | 6th Grade OR 9th Grade | Set campus goal | Red (Percentage) = if the calculated delta is less than the campus goal Black (Percentage ) = if the calculated delta is equal to or greater than the campus goal |
7th Grade OR 10th Grade | Set campus goal | Red (Percentage) = if the calculated delta is less than the campus goal Black (Percentage ) = if the calculated delta is equal to or greater than the campus goal | |
8th Grade OR 11th Grade | Set campus goal | Red (Percentage) = if the calculated delta is less than the campus goal Black (Percentage) = if the calculated delta is equal to or greater than the campus goal | |
12th Grade | Set campus goal | Red (Percentage) = if the calculated delta is less than the campus goal Black (Percentage) = if the calculated delta is equal to or greater than the campus goal | |
Periodicity
Best practice is to load the data for this metric at least annually prior to the beginning of the school year. Given that TELPAS is administered in the spring time, the data does not need to be uploaded monthly.
Recommended Load Characteristics | |
Calendar | Spring Semester |
Frequency of data load | Spring |
Latency | Yearly |
Interchange schema | Interchange-StudentAssessment.xsd |
Tooltips
The standard tool tips for the metric definition, column headers, and help functions display for this metric.
The following are tooltips specific to the metric:
- Green metric status: OK
- Red metric status: LOW
- 'More' indicates drill down views for this metric
 is ‘No change from the prior period'
 is ‘Getting worse from the prior period’
 is 'Getting better from the prior period'
Business Rules
The English Language Learner assessment addresses the TELPAS examinations.
Students in grades K-12 may take the TELPAS.
Data Assumptions
- The student data is loaded into the DCD.
- Transfer students (late enrollment) who do not have complete transcripts should be indicated.
Computed Values
Table 6 defines how values are calculated for this metric. The result of the calculation displays in the Status column on the campus dashboard.
Metric Values | ||
TELPAS | Grade Level | Total number of students at or above the advanced proficiency / Total number of students taking the TELPAS |
Data Anomalies
Anomalies
The best practice is to footnote to address these anomalies:
- Late enrollees may have taken assessment examinations tests at their previous school
- Students that do not have social security numbers.
- Students who do not ahve valid scores, i.e. 0.0.
Date of Refresh
Best practice is for the date of last data refresh to appear next the metric in the following format:
- (Through April 2010)
Implementation Considerations
TELPAS Participation Expectation
Students may take the Pre-LAS, LAS and LAS-O from K-2nd grade. The TELPAS examination may be taken from 2nd through 12th grades. Proper application of the metric requires the district or campus to establish clear expectations for when students should take the examination, and if a student has not taken any language assessment, at what point an intervention is in order.
Apparent Non-Participation
Assuming that the district has received and loaded timely test result data from Pre-LAS, LAS, LAS-O or TELPAS, students who did not participate in the test can be identified by the report comments. Table 7 defines the report comments.
Report Comment | Definition of Code |
EC = EXTENUATING CIRCUMSTANCES | Student could not be rated because of extenuating circumstances. |
- - - NO RATING / INFORMATION AVAILABLE | Student did not take TELPAS reading or comprehension and composite information could not be determined because the appropriate language-area proficiency ratings were not available. |
AB = NOT TESTED—ABSENT | Student was absent during the TELPAS reading test. |
X = NOT TESTED—ARD DECISION | Student did not participate on the basis of special education needs as determined by his or her admission, review, and dismissal (ARD) committee in conjunction with the language proficiency assessment committee (LPAC) and documented in the student's individualized education program. |
O = NOT SCORED—OTHER | TELPAS reading score code was coded “OTHER” due to a test administration irregularity or illness during testing. |
Incomplete Transcripts and Missing TELPAS Scores
Transfer students may have incomplete transcripts that do not show prior TELPAS participation. Timely acquisition of a transfer student’s transcript is imperative to apply this metric.
TELPAS and STAAR Considerations
In an effort to ensure a strong link between academic language proficiency as defined through TELPAS and academic achievement as defined by STAAR, the TELPAS exam may be adjusted.
Drill Downs
The dashboards include the option to see more detail that is associated with a specific metric. Table 8 lists the drill down views that are recommended for this metric.
| Historical | Graph of metric values across multiple time periods. | |
| Student List | List of students who do not meet the threshold for this metric for the specified period. |
User Interface
Figure 3 shows the historical chart drill down for the TELPAS metric as seen on the campus dashboard.
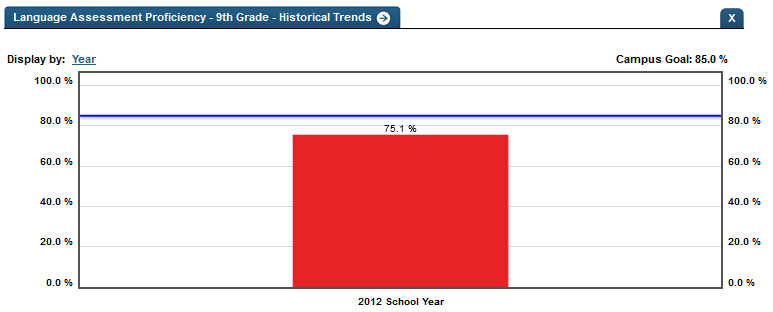
Figure 3 TSDS TELPAS Historical Chart
Business Rules
The Historical Graph allows the user to see historical data across multiple timeframes. As time passes, there are many bars to be displayed; therefore, the slider on the bottom allows the user to adjust the number of bars displayed as well as the time period shown. The timeframes for this metric were chosen based on educator feedback.