Dashboard Metrics


TPRI
Background
Campus Level Metric
TPRI is given to many students across Texas in the early grades. Is serves as a screening tool to identify students who will need extra help to be reading on grade level by the end of the year. This assessment has been developed in response to the large number of requests for this data from elementary educators in the LPR districts.
Primary Metric
TPRI: the percentage of students scoring developed on the most recent administration
User Interface
Dashboard Example
Figure 1 shows the TPRI as seen on the campus dashboard.

Figure 1 TSDS TPRI Metric
Status Definition on the Dashboard
The Status Indicator is determined by campus-specific thresholds (campus goals) which are set at the district level. The TSDS default threshold is for campuses is 70%.
| Metric Indicators | ||
Metric Name | Metric Status Indicator | Trend |
TPRI | Red =percent of students scoring D on the most recent assessment is less than 70% or greater Green = percent of students scoring D on the most recent assessment is 70% or greater" | |
| Prior Year TPRI | Red =percent of students scoring D on the most recent assessment is less than 70% or greater Green = percent of students scoring D on the most recent assessment is 70% or greater" | |
Trend Definition
Table 3 lists the trend indicators for the TPRI metric.
The trend does not display if the student has not taken a previous benchmark assessment.
Trend Indicators: Objective is to indicate TPRI objective mastery | ||
| Up green | If the value has increased 5% or more since the prior administration |
| Unchanged | If the value has not changed or changed less than 5% from the prior administration |
| Down red | If the value has decreased 5% or more from the prior period. |
Delta Definition
Delta Indicators: Objective is to indicate TPRI objective mastery | ||
Metric Name | Campus Goal | Delta |
TPRI | Set Campus Goal | Red (Percentage) = if the calculated delta is less than the campus goal Black (Percentage) = if the calculated delta is equal to or greater than the campus goal |
| Prior Year TPRI | Set Campus Goal | Red (Percentage) = if the calculated delta is less than the campus goal Black (Percentage) = if the calculated delta is equal to or greater than the campus goal |
Periodicity
Recommended Load Characteristics | |
| Calendar | Beginning, Middle and End of Year |
| Frequency of data load | Three times a year |
| Latency | School Year |
| Interchange schema | Interchange-StudentAssessment.xsd |
Tooltips
The standard tool tips for the metric definition, column headers, and help functions display for this metric.
- Green metric status: OK
- Red metric status: LOW
- 'More' indicates drill down views for the metric.
 is ‘No change from the prior period'
 is ‘Getting worse from the prior period’
 is 'Getting better from the prior period'
Business Rules
Data Assumptions
- Campus must report scores for all the sections given to the student as well as their score for the assessment as a whole.
- Student scores are listed by count as well as score (Still Developing or Developed)
- Campuses only administer the TPRI for grades K-2
Computed Values
The status equals the number of students with a score of D over the number of students with a TPRI score for the campus.
TPRI Identification
The assessment vendor must to identify the following based components from the enumerated set of data: grade level, classroom/section, campus and date of administration.
Data Anomalies
Anomalies
- Late enrollees may have taken Benchmark Assessment tests at their previous school
- Loading of data from multiple administration dates
Footnotes
Best practice is for the developer to footnote the following:
- The date and the school year that the Reading Assessment scores were last loaded.
Date of Refresh
The date of refresh should display as (Through MOY 2012)
Drill Downs
Drill Down Views
The dashboards include the option to drill down and see more detail that is associated with a metric. Table 5 lists the drill down views that are recommended for this metric.
| Grade Level | Graph of percent of students meeting the student threshold for the metric by grade level | |
| Student List | List of students who do not meet the student level threshold for the metric for the "specified timeframe" |
User Interface
Figure 2 shows Grade Level Chart for the TPRI metric as seen on the campus dashboards.
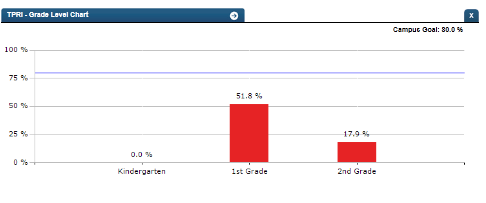
TSDS Campus Level Grade Level Drilldown
Drill down Tooltips
Grade Level Chart:
- The number of students who met the student goal out of the total number of students enrolled on the campus will display as you hover over the bars of the graph.
- Green bar = met the campus goal
- Red bar = did not meet the campus goal