Dashboard Metrics


TPRI
Background
Student Level Metric
Early reading inventories assess early reading skills and predict early reading success. All reading inventories are broken into several sections, one for each skill assessed. The student is asked a series of questions and receives points for correct answers. For the classroom educator the value of these assessments lies with the individual section scores. Unlike reading level assessments, the sections and tasks for inventories are based on the time of year and the grade level of the student. TPRI is given 3 times each year [beginning-of-year (BOY), middle-of-year (MOY), and end-of-year (EOY)].
Primary Metric
TPRI: a student's score on the most recent TPRI assessment
User Interface
Dashboard Example
Figure 1 shows the TPRI Reading Assessment as seen on the student dashboard.

Figure 1 TSDS Student TPRI Reading Assessment Metric
Status Definition on the Dashboard
The Status indicator is determined by campus-specific thresholds (campus goals) which are set at the district level. The default threshold is for students to meet the 'Developed" threshold
Metric Indicators | ||
Metric Name | Metric Status Indicator | Trend |
TPRI | Red (SD) = if student's score equals " Still Developing" Green (D ) = if student's score equals "Developed" | Compare previous assessments |
| Prior Year TPRI | Red (SD) = if student's score equals " Still Developing" Green (D ) = if student's score equals "Developed" | |
(a) For each subject, the Value column displays the student's score for the Reading Assessment.
Trend Definition
Table 3 lists the trend indicators for the TPRI Reading Assessment Mastery metric.
The trend does not display if a student does not have a prior TPRI score.
Trend Indicators: Objective is to indicate TPRI objective mastery | |||
| Up green | If the value for the assessment has changed from "Still Developing" to "Developed" since the prior administration | |
| Unchanged | If the value for assessment has not changed since the prior administration. | |
| Down red | If the value for the assessment changed from 'Developed" to "Still Developing" since the prior administration. | |
Delta Definition
Delta Indicators: Objective is to indicate TPRI objective mastery | ||
Metric Name | Student Goal | Delta |
TPRI | Set Student Goal | Red (Percentage) = if the calculated delta is less than the campus goal Black (Percentage) = if the calculated delta is equal to or greater than the campus goal |
Periodicity
Recommended Load Characteristics | |
Calendar | Beginning, Middle and End of Year |
Frequency of data load | Three times a year |
Latency | School Year |
Interchange schema | Interchange-StudentAssessment.xsd |
Tooltips
The standard tool tips for the metric definition, column headers, and help functions display for this metric.
- Green metric status: D (Developed)
- Red metric status: SD (Still Developing)
- 'More' indicates drilldown views for this metric.
 "Getting better from the prior period."
 "Getting worse from the prior period."
 "No change from the prior period."
Business Rules
Data Assumptions
- Campus must report student scores for each component section, as well as an overall score.
- Student scores are listed by count as well as score (Still Developing or Developed)
- Campuses only administer the TPRI for grades K-3
Computed Values
There are no computed values for this metric as it simply displays the score as listed in the data file.
TPRI Identification
When mapping to the district data, the district needs to identify the following based components from the enumerated set of data: grade level, classroom/section, campus and date of administration.
Data Anomalies
Anomalies
- Late enrollees may have taken the TPRI test at their previous school; these results will likely not be available.
- Loading of data from multiple administration dates.
- The dashboards display the overall screening score for TPRI, which is conducted at the beginning of the year (BOY). Students that were not screened again (but took another section of the test) will not have a result for subsequent administrations (MOY, EOY).
Footnotes
Best practice is for the developer to footnote the following:
- The date and the school year that the Reading Assessment scores were last loaded.
Date of Refresh
The date of refresh should display as (Through MOY 2017)
Drill Downs
Drill Down Views
The dashboards include the option to drill down and see more detail that is associated with a metric. Table 5 lists the drill down views that are recommended for this metric.
| Historical Chart | Graph of metric values across multiple time periods. | |
| Objectives | Chart of TPRI student objectives and whether or not the objective was met. |
User Interface
Figure 2 displays the historical chart for the TPRI Reading Assessment as seen on the student dashboards.
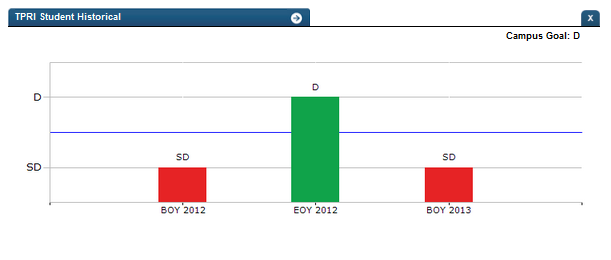
Figure 2 TSDS TPRI Historical Chart
Figure 3 displays the objectives (student expectations) for the TPRI Reading Assessment as seen on the student dashboards.
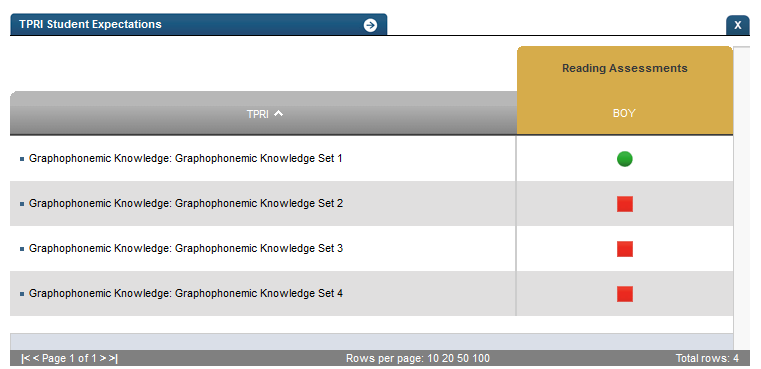
Figure 3 TSDS TPRI Objectives
Business Rules
For the objective status, the system must display the following:
- Red square = The student did not answer correctly <70% correct if >1 question testing TPRI item
- Green circle = The student answered correctly >70% correct if >1 question testing TPRI item
Tooltips
Historical Chart
- Red bar: SD (Still Developing)
- Green bar: D (Developed)
Objectives
- Red square: SD (Still Developing) or PSD (Potentially Still Developing)
- Green circle: D (Developed)