Dashboard Metrics


Tejas LEE
Background
Student Level Metric
Tejas LEE is given to many students across Texas in the early grades. Is serves as a screening tool to identify students who will need extra help to be reading on grade level by the end of the year. This assessment has been developed in response to the large number of requests for this data from elementary educators in the LPR districts.
Tejas LEE assesses a variety of grade-appropriate Spanish reading and language skills. Students receive one of three scores for each component:
- Desarrollado (D): The student has mastered the skill and this skill does not need to be revisited.
- Nivel Esperado (NE): The student has not yet mastered the skill, but is well on his/her way to mastery and does not need to be targeted for intervention.
- Nivel de Intervención (NI): The student is performing in the lowest 25% of the population on this skill at this time point and additional attention is recommended.
Primary Metric
Tejas LEE: the percentage of sections where the student scores a D out of the total sections assessed on the most recent Tejas LEE assessment.
User Interface
Dashboard Example
Figure 1 shows the Tejas Lee as seen on the campus dashboard.
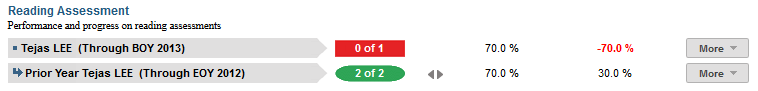
Figure 1 TSDS Student Tejas Lee Metric
Status Definition on the Dashboard
The Status indicator is determined by campus-specific thresholds (campus goals) which are set at the district level. The default threshold is for students to score a D on 70% or more of the sections assessed. The Metric Value displays the number of sections on which the student scored "D" out of the total number of sections assessed.
Metric Indicators | |||
Metric Name | Metric Status Indicator | Trend | Campus Goal (Delta) |
Tejas LEE | Red (Low) = if student's score does not equal "D" on 70% of the sections assessed Green (OK) = if student's score equals "D" on 70% of the sections assessed | Current and prior assessment | Student Goal and the calculated assessment score |
(a) For each subject, the Value column displays the student's score for the Reading Assessment.
Trend Definition
Table 3 lists the trend indicators for the Tejas LEE metric.
The trend does not display if the student has not taken a previous assessment.
Trend Indicators: Objective is to indicate Tejas LEE | |||
| Up green | If the value for the reading assessment has changed from "NE" or "NI" to "D" since the prior administration | |
| Unchanged | If the value for reading assessment tested at the same level as the prior administration. | |
| Down red | If the value for the reading assessment changed from 'D" to "NE or NI" even if the student was not retested in the same tasks as the test itself evolves over time. | |


Delta Definition
Delta Indicators: Objective is to indicate Tejas Lee | ||
Metric Name | Student Goal | Delta |
Tejas Lee | Set Student Goal | Red (Percentage) = if the calculated delta is less than the campus goal Black (Percentage) = if the calculated delta is equal to or greater than the campus goal |
Periodicity
Recommended Load Characteristics | |
| Calendar | Beginning, Middle and End of Year |
| Frequency of data load | Three times a year |
| Latency | School Year |
| Interchange schema | Interchange-StudentAssessment.xsd |
Tooltips
The standard tool tips for the metric definition, column headers, and help functions display for this metric.
- Green metric status: OK
- Red metric status: LOW
- 'More' indicates drill down views for the metric
 'Getting better from prior period'
 'Getting worse from prior period'
 'No change from the prior period'
Business Rules
Data Assumptions
- Campus must report scores for all the sections given to the student
- Student scores are listed by count as well as score (D, NE, or NI) for each section of the assessment.
- Campuses only administer the Tejas LEE for grades K-3.
Computed Values
There are no computed values for this metric as it simply displays the score as listed in the data file.
Test Identification
The assessment vendor must to identify the following based components from the enumerated set of data: grade level, classroom/section, campus and date of administration.
Data Anomalies
Anomalies
- Transfer students may not have data available in the dashboards.
- Only the most recent test administration will display in the dashboard.
Footnotes
Best practice is for the developer to footnote the following:
- The date and the school year that the Reading Assessment scores were last loaded.
Date of Refresh
The date of refresh should display as
Drill Downs
Drill Down Views
The dashboards include the option to drill down and see more detail that is associated with a metric. Table 6 lists the drill down views that are recommended for this metric.
| Historical | Graph of metric values across multiple time periods | |
| Student Expectations | List of assessment objectives and whether or not the student met the goal for the objective. |
User Interface
Figure 2 shows the historical chart for the Tejas LEE metric as seen on the student dashboards.
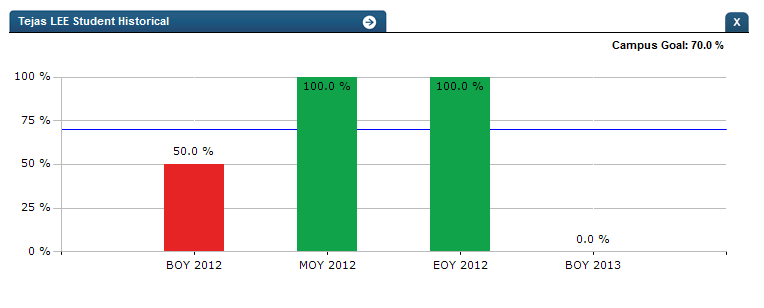
Figure 2 TSDS Tejas LEE Historical Chart
Figure 3 shows the student expectations and objectives for the Tejas LEE metric as seen on the student dashboards.
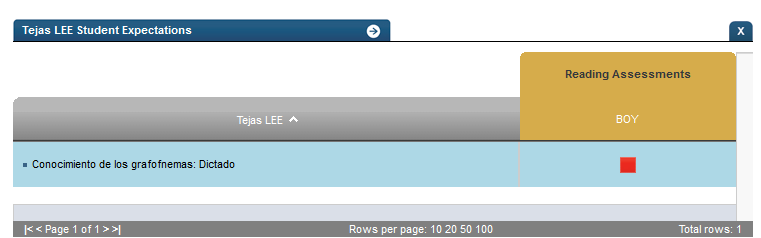
Figure 3 TSDS Tejas LEE Student Expectation and Objective List
Business Rules
For the objective status, the system must display the following:
- Red square = The student did not answer correctly <70% correct if >1 question testing Tejas LEE item
- Green circle = The student answered correctly >70% correct if >1 question testing Tejas LEE item
Tooltips
Historical Chart
- Red bar: NE (Nivel Esperado) or NI (Nivel de Intervencion)
- Green bar: D (Desarrollando)
Objectives
- Red square: NE (Nivel Esperado) or NI (Nivel de Intervencion)
- Green circle: D (Desarrollando)