Dashboard Metrics


STAAR - Alt
Background
The State of Texas Assessments of Academic Readiness (STAAR) program is designed to measure the Texas Essential Knowledge and Skills (TEKS) curriculum standards. In spring 2012, the STAAR assessment replaced the Texas Assessment of Knowledge and Skills (TAKS) assessment. The STAAR assessment includes grade-level assessments for grades 3-8 and end of course (EOC) assessments for high school level subjects. STAAR assessments for grades 3-8 are in a defined testing window in April and May. Students that do no meet standards may be re-assessed in July for promotion consideration. Students in grades 3-8 will be assessed in the following subjects:
- Mathematics (Grades 3-8)
- Reading (Grades 3-8)
- Writing (Grades 4, 7)
- Science (Grades 5, 8)
- Social Studies (Grade 8)
STAAR Alternate 2 meets the federal requirements mandated under the Elementary and Secondary Education Act (ESEA) and is designed for the purpose of assessing students in grades 3-8 and high school who have significant cognitive disabilities and are receiving special education services.
There are three levels of academic performance for the STAAR assessment:
- Level III: Advanced - student is well prepared and has a high likelihood of success in the next grade or course; student also demonstrates the ability to think critically and apply the assessed knowledge and skills in varied contexts both familiar and unfamiliar and will require little to no academic intervention.
- Level II: Satisfactory– student is sufficiently prepared and has a reasonable likelihood of success in the next grade or course; student also demonstrates the ability to think critically and apply the assessed knowledge and skills in familiar contexts and may require short term, targeted academic intervention.
- Level I: Unsatisfactory– student is inadequately prepared and unlikely to succeed in the next grade or course; student does not demonstrate a sufficient understanding of the assessed knowledge and skills and will require ongoing academic intervention.
The dashboard will display the student’s scale score. The scale score is a conversion of the raw score onto a scale that is common to all test forms for that assessment. It takes into account the difficulty level of the specific set of questions on which it is based. The scale score also quantifies the students’ performances relative to the passing standards and proficiency levels. Beginning in 2012-13, students must achieve a Level II on the STAAR assessment to meet the Student Success Initiative (SSI) promotion requirements for grades 5 and 8 reading and mathematics.
Primary Metric
- STAAR Alternate
Related Metrics
- STAAR Performance
- STAAR AlternateSTAAR L
User Interface
Dashboard Example
Figure 1 shows the STAAR Performance metric as seen on the student dashboard.
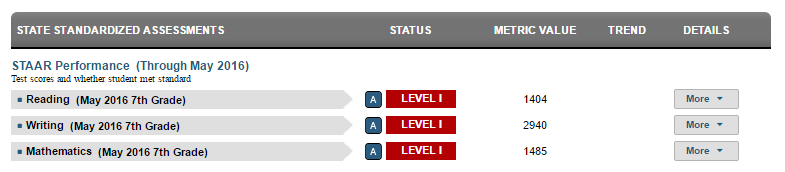
Figure 1 TSDS STAAR Alternate Metric
Status Definition on the Dashboards
This metric provides information regarding a student’s performance on the STAAR Alternate Assessment. The student’s performance level and scale score are displayed. The status indicator is determined by the student’s performance level on the most recent assessment administration for the following subject areas:
- Reading
- Writing
- Mathematics
- Science
- Social Studies
The value displayed for the metric value is the student’s scale score for the most recent administration of the STAAR Alternate assessment in each subject area.
Table 2 Metric Indicators for TSDS STAAR 3-8 Alternate Metric
Metric Indicators | Trend Comparisons | |||
Container Name | Granular Name | Metric Status Indicator (a) | Compares: | To: |
STAAR Performance | Reading | Red = Level I Green = Level II, III | N/A | N/A |
Writing | Red = Level I Green = Level II, III | N/A | N/A | |
Mathematics | Red = Level I Green = Level II, III | N/A | N/A | |
Science | Red = Level I Green = Level II, III | N/A | N/A | |
Social Studies | Red = Level I Green = Level II, III | N/A | N/A | |
(a) The Metric Status Indicator column displays the student’s performance level for the STAAR assessment.
Trends
There is no trend calculation for this metric.
Periodicity
Best practice is to load the data for this metric each time there are new assessment files.
Table 3 Recommended Load Characteristics for
TSDS STAAR 3-8 Alternate Performance
Recommended Load Characteristics | |
Calendar | Late Spring and late summer |
Frequency of data load | When new files are available |
Latency | Yearly |
Interchange schema | Interchange-StudentAssessment.xsd |
Tooltips
The standard tool tips for the metric definition, column headers, and help functions display for this metric.
The following are tooltips specific to the metric:
- Green metric status: OK
- Red metric status: Not Met
Business Rules
STAAR, STAAR Modified, and STAAR Alternate will display as separate container metrics. The granular metrics (subject areas) will display in each of these container metrics. If a student took one subject area test in STAAR – M or STAAR – Alt, that subject’s granular metric will display under the STAAR – M or STAAR – Alt container metric, while the other subject areas will display under the STAAR container metric.
The STAAR 3-8 Alternate includes assessments formatted for students who are receiving special education services. This metric displays a student’s scale score for the following subjects:
- Reading
- Writing
- Mathematics
- Science
- Social Studies
- Status is determined by the performance level indicated in the file.
- Cut scores to determine Level I and Level II cut scores were instituted in Spring 2014.
- Level III performance level is set at the final recommended standard.
- If the student did not meet Level II requirements it is inferred that the student’s performance level is Level I.
- If a student meets Level II requirements it is inferred that the student met Level I requirements.
- If a student meets Level III requirements it is inferred that the student met Level I and Level II requirements.
What to display:
- Display container metric only when data is available.
- Display granular metrics when data becomes available.
- Do not display this container metric if data is only available for STAAR or STAAR-Alt.
- If there is no data for a granular metric it will not display.
- Elementary and Middle school students are included in this metric.
- Continue to display most recent STAAR 3-8 results on the student-level academic dashboard even after student advances beyond 8th grade. These scores will not contribute to a campus roll-up for high schools, and high schools will not appear in the district performance list for this metric.
Data Assumptions
- The data will give us the raw and scale scores.
- The data will indicate the performance level (Level I, Level II, Level III).
- The data will provide reporting category information.
- The data will provide historical information.
- The data will provide accommodation information for a student.
The data shows the scale score; therefore, there are no computed values for this metric.
Data Anomalies
Anomalies
- Metrics are sensitive to when and how often the data is loaded
- Early education and Pre-Kindergarten students and students in grades 1 and 2 will not have data for this metric even though the metric will appear under the State Assessments tab.
- Students receiving instruction in a grade higher than the grade in which they are enrolled will be assessed at the higher level if the content covers the entire curriculum for that subject.
- Some students may have taken the exam, but the file reports “No Score”. The metric status should display “Taken” in this case, with no scale score.
- “Taken” will also display on the historical assessment exam.
- Late enrollees may have taken the STAAR at their previous school.
- Data will be loaded from multiple administration dates.
- STAAR metric will display the most recent exam data.
Footnotes
Date of Refresh
Best practice is for the date of the last data refresh to appear next to the metric in the following format:
- (Through April 2010)
Drill Downs
Description
Drill Down View
This metric includes the option to drill down for information that is associated with this metric. Table 5 lists the drill down views that are defined for this metric.
Table 5 Metric Drill Down Views for STAAR Alternate Performance
Reporting Categories | The detail view shows the reporting categories for the STAAR Alternate assessments the student has taken in grades 3-8. |
The objective is to provide a measure of readiness for the next grade level.
User Interface Notes
Dashboard Example
Figure 2 shows the STAAR Alternate Performance Reporting Categories Drill Downon the student dashboard.
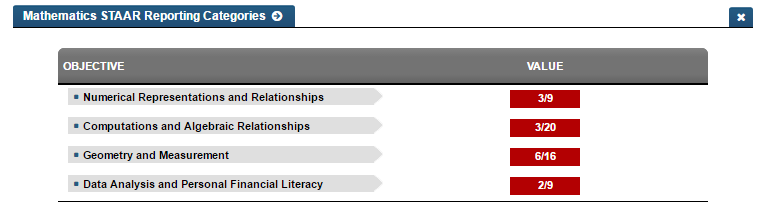
Figure 2 STAAR Alternate Reporting Categories
Business Rules
- The Reporting Categories will display a numerator/denominator format.
- Numerator = number of questions answered correctly for the reporting category, Denominator = total number of questions for the reporting category
- The status indicator will display:
o Green = if student percent correct on the reporting category is above 70%
o Red = if student percent correct on the reporting category is below 70%
o A student’s performance on Reporting Categories may not be an indication of the student’s performance level on the overall exam.