Dashboard Metrics


STAAR End of Course - M
Background
The State of Texas Assessments of Academic Readiness (STAAR) program is designed to measure the Texas Essential Knowledge and Skill (TEKS) curriculum standards. In spring 2012, the STAAR assessment replaced the Texas Assessment of Knowledge and Skills (TAKS) assessment. The STAAR assessment includes grade-level assessments for grades 3-8 and end of course (EOC) assessments for high school level subjects. STAAR EOC exams are administered at the end of the fall, spring, and summer semesters. Students sit for EOC exams upon completion of the course. The EOC assessments will be administered in the following subjects:
- English I, II, III (Reading)
- English I, II, III (Writing)
- Algebra I, II
- Geometry
- Biology
- Chemistry
- Physics
- World Geography
- World History
- US History
A Level III: Advanced Academic Performance achievement in the following subject areas indicates that the students are prepared for postsecondary endeavors with support:
- STAAR End of Course – English III, Algebra II
- STAAR End of Course M – English III
A Level II: Satisfactory Academic Performance achievement in the following subject areas indicates that the students are prepared for postsecondary endeavors with support:
- STAAR End of Course – English III, Algebra II
Primary Metric
- STAAR End of Course Modified
Related Metrics
- STAAR End of Course Performance
- STAAR End of Course Alternate
- STAAR End of Course L
User Interface
Dashboard Example
Figure 1 shows the STAAR Performance metric as seen on the student dashboard.
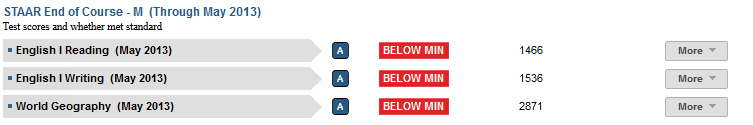
Figure 1 TSDS STAAR EOC Modified Metric
Status Definition on the Dashboards
This metric provides information regarding the STAAR End of Course Modified Assessments. The student’s performance level and scale score are displayed. The status indicator is determined by student’s performance level on the most recent assessment administration for the following subjects:
- English I, II, III (Reading)
- English I, II, III (Writing)
- Algebra I, II
- Geometry
- Biology
- Chemistry
- Physics
- World Geography
- World History
- US History
Table 2 Metric Indicators for TSDS STAAR EOC Modifed Metric
Metric Indicators | Trend Comparisons | ||||
Container Name | Granular Name | Metric Status Indicator (a) | Compares: | To: | |
STAAR EOC Performance | English I Reading | Red = Below Minimum, Level I Green = Level II, III | N/A | N/A | |
English II Reading | Red = Below Minimum, Level I Green = Level II, III | N/A | N/A | ||
English III Reading | Red = Below Minimum, Level I Green = Level II, III | N/A | N/A | ||
English I Writing | Red = Below Minimum, Level I Green = Level II, III | N/A | N/A | ||
English II Writing | Red = Below Minimum, Level I Green = Level II, III | N/A | N/A | ||
English III Writing | Red = Below Minimum, Level I Green = Level II, III | N/A | N/A | ||
Algebra I | Red = Below Minimum, Level I Green = Level II, III | N/A | N/A | ||
Algebra II | Red = Below Minimum, Level I Green = Level II, III | N/A | N/A | ||
Geometry | Red = Below Minimum, Level I Green = Level II, III | N/A | N/A | ||
Biology | Red = Below Minimum, Level I Green = Level II, III | N/A | N/A | ||
Chemistry | Red = Below Minimum, Level I Green = Level II, III | N/A | N/A | ||
Physics | Red = Below Minimum, Level I Green = Level II, III | N/A | N/A | ||
World Geography | Red = Below Minimum, Level I Green = Level II, III | N/A | N/A | ||
World History | Red = Below Minimum, Level I Green = Level II, III | N/A | N/A | ||
US History | Red = Below Minimum, Level I Green = Level II, III | N/A | N/A | ||
(a) The Metric Status Indicator column displays the student’s performance level for the STAAR EOC assessment.
Trends
There are no trends calculated for this metric.
Periodicity
Best practice is to load the data for this metric each time there are new assessment files.
Table 3 Recommended Load Characteristics for
TSDS STAAR EOC Modified Performance
Recommended Load Characteristics | |
Calendar | Following Spring, Summer, and Fall administrations |
Frequency of data load | When new files are available |
Latency | Yearly |
Interchange schema | Interchange-StudentAssessment.xsd |
Tooltips
The standard tool tips for the metric definition, column headers, and help functions display for this metric.
The following are tooltips specific to the metric:
- Green metric status: OK
- Red metric status: Not Met
Business Rules
Business Rules
STAAR End of Course, STAAR End of Course Modified, and STAAR End of Course Alternate will display as separate container metrics. The granular metrics (subject areas) will display in each of these container metrics. If a student took one subject area test in STAAR End of Course – M or STAAR End of Course – Alt, that subject’s granular metric will display under the STAAR End of Course – M or STAAR End of Course – Alt container metric, while the other subject areas will display under the STAAR container metric.
The STAAR EOC Performance includes regularly formatted assessments with modifications. This metric displays a student’s scale score for the following subjects:
- English I, II, III (Reading)
- English I, II, III (Writing)
- Algebra I, II
- Geometry
- Biology
- Chemistry
- Physics
- World Geography
- World History
- US History
Middle and high school students are included in this metric. Students may begin taking End of Course Exams as early as 7th grade, if they are enrolled in any of the courses listed above.
Status is determined by the performance level indicated in the file.
- Cut scores to determine Level I and Level II cut scores will be phased in until Spring 2013.
- Level III performance level is set at the final recommended standard.
- If the student did not meet Minimum requirements, display “Below Min”.
- If the student met minimum requirements, but did not meet Level II requirements it is inferred that the student’s performance level is Level I.
- If a student meets Level II requirements it is inferred that the student met Level I requirements; display Level II.
- If a student meets Level III requirements it is inferred that the student met Level I and Level II requirements, display Level III.
Accommodations:
- An accommodation icon will display next to the granular metric if the student was reported as having an accommodation
- Specific accommodations will not show on the dashboards.
What to display:
- Always display STAAR Reading and Mathematics metrics for students in grades 9-12.
- Display the container and granular metrics when data becomes available.
- Do not display this container metric if data is only available for STAAR End of Course or STAAR End of Course – Alt.
- If there is no data for a granular metric it will not display.
Data Assumptions
- The data will give us the raw and scale scores.
- The data will indicate the performance level (Level I, Level II, Level III).
- The data will provide reporting category information.
- The data will provide historical information.
- The data will provide accommodation information for a student.
Computed Values
The data shows the scale score; therefore, there are no computed values for this metric.
Data Anomalies
Data Anomalies
Anomalies
- Metrics are sensitive to when and how often the data is loaded
- Early education and Pre-Kindergarten students and students in grades 1 and 2 will not have data for this metric even though the metric will appear under the State Assessments tab.
- Students receiving instruction in a grade higher than the grade in which they are enrolled will be assessed at the higher level if the content covers the entire curriculum for that subject.
- Some students may have taken the exam, but the file reports “No Score”. The metric status should display “Taken” in this case, with no scale score.
- “Taken” will also display on the historical assessment exam.
- Late enrollees may have taken the STAAR at their previous school.
- Data will be loaded from multiple administration dates.
- STAAR metric will display the most recent exam data.
Footnotes
Date of Refresh
Best practice is for the date of the last data refresh to appear next to the metric in the following format:
- (Through April 2010)
Implementation Considerations
STAAR Participation Expectation
Students will take the STAAR EOC assessments at the conclusion of the required course. Proper application of the metric requires the district or campus establish clear expectations for when students should take the STAAR assessments, and if a student has not taken the assessments, at what point an intervention is in order.
Incomplete Transcripts and Missing STAAR Scores
Transfer students may have incomplete transcripts that do not show prior STAAR participation.
Drill Downs
Description
Drill Down View
This metric includes the option to drill down for information that is associated with this metric. Table 5 lists the drill down views that are defined for this metric.
Table 4 Metric Drill Down Views for STAAR EOC Modified Metrics
More Menu: | The detail view shows the reporting categories for the most recent STAAR EOC Modified assessment the student has taken. |
The objective is to provide a measure of readiness for the next level within a subject area.
User Interface Notes
Dashboard Example
Figure 2 shows the STAAR EOC Performance Reporting Categories Drill Downon the student dashboard.

Figure 2 STAAR EOC Modified Reporting Categories
Business Rules
- The Reporting Categories will display the number of questions answered correctly over the number of questions on the assessment.
- Numerator = number of questions answered correctly for the reporting category, Denominator = total number of questions for the reporting category.
- The status indicator will display:
o Green = if student percent correct on the reporting category is above 70%
o Red = if student percent correct on the reporting category is below 70%
o A student’s performance on Reporting Categories may not be an indication of the student’s performance level on the overall exam.