Dashboard Metrics


STAAR Performance
Background
Campus Dashboard Metric
The State of Texas Assessments of Academic Readiness (STAAR) program is designed to measure the Texas Essential Knowledge and Skills (TEKS) curriculum standards. In spring 2012, the STAAR assessment replaced the Texas Assessment of Knowledge and Skills (TAKS) assessment. The STAAR assessment includes grade-level assessments for grades 3-8 and end of course (EOC) assessments for high school level subjects. STAAR assessments for grades 3-8 are in a defined testing window in April and May. Students that do no meet standards may be re-assessed in July for promotion consideration. Students in grades 3-8 will be assessed in the following subjects:
- Mathematics (Grades 3-8)
- Reading (Grades 3-8)
- Writing (Grades 4, 7)
- Science (Grades 5, 8)
- Social Studies (Grade 8)
Introduction
The State of Texas Assessments of Academic Readiness (STAAR) program is designed to measure the Texas Essential Knowledge and Skills (TEKS) curriculum standards. In spring 2012, the STAAR assessment replaced the Texas Assessment of Knowledge and Skills (TAKS) assessment. The STAAR assessment includes grade-level assessments for grades 3-8 and end of course (EOC) assessments for high school level subjects.
The STAAR assessment is available in the following forms: paper, online, braille, and Spanish.
There are four versions of the STAAR assessment:
- STAAR replaces the TAKS assessment and includes assessments for grades 3-8 and End of Course exams for high school level subjects.
- STAAR Alternate 2 meets the federal requirements mandated under the Elementary and Secondary Education Act (ESEA) and is designed for the purpose of assessing students in grades 3-8 and high school who have significant cognitive disabilities and are receiving special education services.
- STAAR L is a linguistically accommodated English version of the STAAR for grades 3-8 and EOC mathematics, science, and social studies assessments. It is provided for English Language Learners (ELLs) who meet participation requirements for a substantial degree of linguistic accommodation in these subject areas. After the December 2016 administration, STAAR L will no longer be administered.
- STAAR Spanish is available in grades 3-5 in reading, writing, mathematics, and science. STAAR Spanish is administered to eligible students for whom a Spanish version of STAAR is the most appropriate measure of their academic progress. STAAR Spanish tests are grade-level assessments and test the same grades and subjects as the general STAAR.
There are three levels of academic performance for the STAAR assessment:
- Level III: Advanced - student is well prepared and has a high likelihood of success in the next grade or course; student also demonstrates the ability to think critically and apply the assessed knowledge and skills in varied contexts both familiar and unfamiliar and will require little to no academic intervention.
- Level II: Satisfactory– student is sufficiently prepared and has a reasonable likelihood of success in the next grade or course; student also demonstrates the ability to think critically and apply the assessed knowledge and skills in familiar contexts and may require short term, targeted academic intervention.
- Level I: Unsatisfactory– student is inadequately prepared and unlikely to succeed in the next grade or course; student does not demonstrate a sufficient understanding of the assessed knowledge and skills and will require ongoing academic intervention.
The dashboard will display the percent of students who have met the Level II goal in Reading, Writing, Mathematics, and Science. Beginning in 2012-13, students must achieve a Level II on the STAAR assessment to meet the Student Success Initiative (SSI) promotion requirements for grades 5 and 8 reading and mathematics.
Primary Metric
- STAAR Performance
User Interface
Dashboard Example
Figure 1 shows the STAAR Performance metric as seen on the campus dashboard.
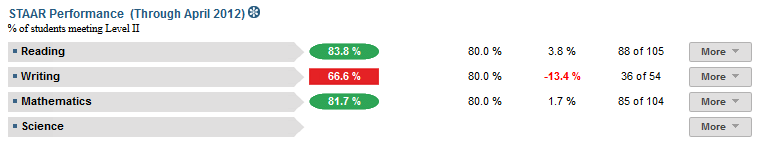
Figure 1 TSDS STAAR Performance Metric
Status Definition on the Dashboards
This metric provides information regarding the overall campus performances for the STAAR Assessment. The Status Indicator is determined by the campus-specific threshold (campus goals) which are set at the district level. The Texas Student Data Systems (TSDS) default threshold is 80% of students meeting the standard of Level II for each subject area.
Table 2 Metric Indicators for TSDS STAAR 3-8 Performance Metric
Metric Indicators | Comparisons | |||
Container Name | Granular Name | Metric Status Indicator (a) | Trend: | Campus Goal (Delta) (b) |
STAAR Performance | Reading | Red = if the percentage of students meeting the standard (Level II) is less than the campus goal Green = if the percentage of students meeting the standard (Level II) is greater than or equal to the campus goal | Prior year to current year | Campus goal and the calculated percentage of students meeting the standard |
Writing | Red = if the percentage of students meeting the standard (Level II) is less than the campus goal Green = if the percentage of students meeting the standard (Level II) is greater than or equal to the campus goal | Prior year to current year | Campus goal and the calculated percentage of students meeting the standard | |
Mathematics | Red = if the percentage of students meeting the standard (Level II) is less than the campus goal Green = if the percentage of students meeting the standard (Level II) is greater than or equal to the campus goal | Prior year to current year | Campus goal and the calculated percentage of students meeting the standard | |
Science | Red = if the percentage of students meeting the standard (Level II) is less than the campus goal Green = if the percentage of students meeting the standard (Level II) is greater than or equal to the campus goal | Prior year to current year | Campus goal and the calculated percentage of students meeting the standard | |
(a) The Metric Status Indicator column displays the percent of students who attained Level II on the most recent STAAR assessment.
(b) Campus Goal (Delta) directly relates to the “Difference from Goal” column on the campus dashboard.
Trends
Trend Indicators: Objective is to indicate STAAR Performance | ||
| Up Green | If the value for the current time frame is more than 10 percentage points higher than the prior time frame, then display a green arrow trending upward. |
| Unchanged | If the value for the current time frame is less than or equal to 10 percentage points higher or is less than or equal to 10 percentage points lower than the prior time frame, then display two gray arrows pointing outward indicating no direction. |
| Down Red | If the value for the current time frame is more than 10 percentage points less than the prior time frame, then display a red arrow trending downward. |
The trend does not show for the first occurrence of a time frame since data is not available.
Delta Definition
The Delta column displays the absolute value of the difference between the campus percentage (Status column) and the campus goal percentage (Campus Goal column).
Table 4 Delta Indicators for STAAR Performance Metric | |||
Delta Indicators: Objective is to indicate STAAR Performance | |||
Metric Name | Sub-Metric Name | Campus Goal | Delta |
STAAR Performance | Reading | Set campus goal | Red (Delta Percentage) = if the STAAR Performance percentage is less than the campus goal Black (Delta Percentage) = if the STAAR Performance percentage is equal to or greater than the campus goal |
Writing | Set campus goal | Red (Delta Percentage) = if the STAAR Performance percentage is less than the campus goal Black (Delta Percentage) = if the STAAR Performance percentage is equal to or greater than the campus goal | |
Mathematics | Set campus goal | Red (Delta Percentage) = if the STAAR Performance percentage is less than the campus goal Black (Delta Percentage) = if the STAAR Performance percentage is equal to or greater than the campus goal | |
Science | Set campus goal | Red (Delta Percentage) = if the STAAR Performance percentage is less than the campus goal Black (Delta Percentage) = if the STAAR Performance percentage is equal to or greater than the campus goal | |
Periodicity
Best practice is to load the data for this metric each time there are new assessment files.
Table 3 Recommended Load Characteristics for TSDS STAAR 3-8 Performance
Recommended Load Characteristics | |
Calendar | Late Spring and late summer |
Frequency of data load | When new files are available |
Latency | Yearly |
Interchange schema | Interchange-StudentAssessment.xsd |
Tooltips
The standard tool tips for the metric definition, column headers, and help functions display for this metric.
The following are tooltips specific to the metric:
- Green metric status: OK
- Red metric status: Not Met
- 'More' indicates drill down views for this metric
 “Getting better from prior period.”
 “Getting worse from prior period.”
 “No change from the prior period.”
Business Rules
STAAR Performance metric contains data for the STAAR, STAAR – M and STAAR – Alt. The subject areas will display as granular metrics.
This metric displays the percent of students who have met the standard for the most recent administration of the STAAR Assessments in the following subject areas:
- Reading
- Writing
- Mathematics
- Science
- The status is determined by the calculation of how many students met the standard divided by how many students took the assessment.
- If a student meets Level II requirements it is inferred that the student met Level I requirements.
- All students who met the standard for STAAR, STAAR – M, and STAAR – Alt will be included in the calculation of students who met the standard.
What to display:
- Always display container and granular metrics.
- Elementary and Middle school students are included in this metric.
- Data will show only for students who are currently enrolled at the campus.
- The prior year data will include all students who were enrolled and took the assessment at the time of administration. The campus prior year data does not change because a student has moved on to high school.
Data Assumptions
- The data will indicate the performance level (Level I, Level II, Level III) for a student.
- The data will provide historical information.
- The data will provide the number of students who met the standard.
- The data will provide the number of students who took the administration.
Computed Values
This campus metric is a roll-up for the cohort of current students, across all grades in the campus. It is computed from the last set of STAAR scores loaded as follows:
- For the majority of the year, the previous year’s STAAR scores are reflected
- Toward the end of the year, the current year’s STAAR scores will be loaded
STAAR Performance | Calculation | Excluded Students |
Each subjects’ percentage | (Number of students in cohort who met the standard for the subject / total number of students in cohort who took the test in the subject) * 100 |
|
Data Anomalies
Anomalies
- Metrics are sensitive to when and how often the data is loaded.
- Early education and Pre-Kindergarten students and students in grades 1 and 2 are not included in the data.
- Students receiving instruction in a grade higher than the grade in which they are enrolled will be assessed at the higher level if the content covers the entire curriculum for that subject.
- Late enrollees may have taken the STAAR at their previous school.
- Data will be loaded from multiple administration dates.
- STAAR metric will display the most recent exam data.
- Campus rollups for current year STAAR Performance will display the performance of students who took STAAR that are still enrolled on that campus. (Ex: when an 8th grader moves to high school their data will no longer be reflected in their middle school’s campus STAAR Performance metric)
Footnotes
Date of Refresh
Best practice is for the date of the last data refresh to appear next to the metric in the following format:
- (Through April 2010)
Implementation Considerations
STAAR Participation Expectation
Students will take the STAAR assessments in grades 3-8. Proper application of the metric requires the district or campus establish clear expectations for when students should take the STAAR assessments based on state requirements, and if a student has not taken the assessments, at what point an intervention is in order.
Incomplete Transcripts and Missing STAAR Scores
Transfer students may have incomplete transcripts that do not show prior STAAR participation.
Drill Downs
Drill Down View
This metric includes the option to drill down for information that is associated with this metric. Table 5 lists the drill down views that are defined for this metric.
Table 5 Metric Drill Down Views for STAAR Performance
Historical Chart | Graph of metric values across multiple time periods | |
| Student List | List of students who did not meet the campus goal. |
The objective is to provide a measure of readiness for the next grade level.
Dashboard Example
Figure 2 shows the STAAR Performance Historical Chart Drill Down the campus dashboard.
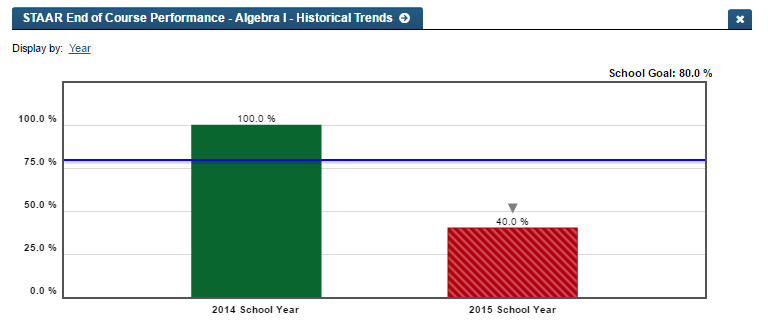
Figure 2 STAAR Performance Historical Drill Down
Business Rules
- The Historical Chart will compare current and prior year data for that subject area.
- This drill down will populate once there are two administrations worth of data.
- The chart will be a bar graph.
- The chart will display
o Green bar = if that cohort year met the standard
o Red bar = if that cohort year did not meet the standard
- Above the bar, the percent of students who met the standard in that subject area will display.
- The hover-over on the bar on the graph will display number of students who met the standard out of the number of students who took the assessment for that subject area.
- The campus goal is displayed in the top right corner of the chart and indicated on the chart by a blue line.