Dashboard Metrics


TEKS Mastery: ELA/Reading and Writing
Background
Student Dashboard Metrics
Benchmark assessments (curriculum-referenced tests) are assessments administered periodically throughout the school year, at specified times during a curriculum sequence, to evaluate students’ knowledge and skills relative to an explicit set of longer-term learning goals. The design and choice of benchmark assessments is driven by the purpose, intended users and uses of the instruments. Benchmark assessment can inform policy, instructional planning and decision-making at the classroom, school and district levels.
Primary Metric
- TEKS Mastery Reading: percentage of TEKS the student has mastered as of the most recent benchmark test and whether or not it meets the campus goal.
User Interface
Dashboard Example
Figure 1 shows the TEKS Mastery ELA/Reading metric as seen on the student dashboard.

Figure 1 TSDS TEKS Mastery ELA/Reading Metric
- An "A" displays next to metric values if a student took an accommodated version (e.g., Spanish or modified)
Status Definition
The Status Indicator is determined by campus-specific thresholds (campus goals) which are set at the district and campus level. The default is 50% for the Number of TEKS Mastered and 70% for the percentage of TEKS correct.
Metric Indicators | Trend Comparisons | |||
Metric Name | Sub-metric Name | Metric Status Indicator | Compares: | To: |
| TEKS Mastery ELA/Reading | Percentage of TEKS correct | Red (Below) = if the student's TEKS percentage correct is less than 70% Green (Above) = if the student's TEKS percentage correct is greater than or equal to 70% | Current assessment score | Previous assessment score |
(a) The Value column displays the number of TEKS the student mastered out of the total number tested.
Trend Definition
Trend Indicators: Objective is to indicate TEKS Mastery ELA/Reading | |||
| Up green | If the value for the current test administration is more than 5 percentage points higher than the prior administration | |
| Unchanged | If the value for the current test administration is less than or equal to 5 percentage points higher or less than or equal to 5 percentage points lower than the prior administration | |
| Down red | If the value for the current test administration is more than 5 percentage points lower than the prior administration | |
The trend does not display if the student has not taken a previous benchmark assessment.
Periodicity
Recommended Load Characteristics | |
Calendar | Throughout the school year |
Frequency of data load | Beginning and end of year |
Latency | 4 weeks |
Interchange schema | Interchange-StudentAssessment.xsd |
Tooltip
The tooltips displayed indicate the metric definition, column headers, and help functions display for this metric.
The following tooltips are specific to the TEKS Mastery ELA/Reading metric:
- Green metric status: OK
- Red metric status: BELOW
- 'More' indicates drill down views for this metric
 is ‘No change from the prior period'
 is ‘Getting worse from the prior period’
 is 'Getting better from the prior period'
Business Rules
All assessment data is displayed by specific subject area:
- Elementary school subjects: reading, mathematics, science and social studies
- Middle school subjects: reading, mathematics, science and social studies, including named high school courses taken by middle school students (e.g., Algebra I)
- High school subjects: courses are grouped into four categories: reading, math, science, and social studies
Data Assumptions
- Content-level standard items for each grade and each subject is available.
- If state content-level standard items (e.g., TEKS) are not mapped, then this metric cannot be calculated.
- If a student is tested on TEKS items from prior grade/future grade, these are read and used for the calculation of detailed items.
Calculated Values
Table 4 defines how values for the sub-metrics are calculated. The result of the calculation displays in the Value column.
| Metric Name | Sub-metric Name | Calculation |
| TEKS MasteryELA/ Reading | Percentage of TEKS correct | Total number of TEKS mastered/Total number of TEKS tested in the subject as of the most recent test administration * 100 |
Calculation Notes
- When a student takes TEKS tests for a different grade level, these are included in the calculation.
Data Anomalies
Anomalies
- If a student transfers from another district and has not taken the test, "N/A" displays and the late enrollment icon displays.
- TEKS are sent with data files from districts. If these are missing, the data will not display.
- Data shows only current year TEKS.
Footnotes
Footnotes are used to provide addition information concerning the metric. Footnotes are sequential for the entire page. Therefore, a metric's footnote may not begin with the number 1.
The following footnotes display below the metric:
- Label or footnote the student's grade level for the displayed TEKS results.
- List number of classrooms with no benchmark or TEKS level data.
Implementation Considerations
Benchmark Assessment Identification
The district or the assessment vendor must identify the following base components from the enumerated set of data: test type, grade level, subject, classroom/section, campus and date of administration.
Types of Interim Assessments
TSDS metrics refer to "benchmarks," but these metrics may accommodate any district-wide formative assessment that is tied to a current state learning standard.
Drill Downs
Drill Down View
The dashboards include the option to see more detail that is associated with a specific metric. Table 6 lists the drill down views that are recommended for this metric.
| TEKS Objectives | TEKS Objectives tested by exam and whether the student met the standard |
User Interface Notes
Dashboard Example
Figure 4 shows the TEKS Objectives deatil for the TEKS Mastery ELA/Reading metric as seen on the student dashboard.
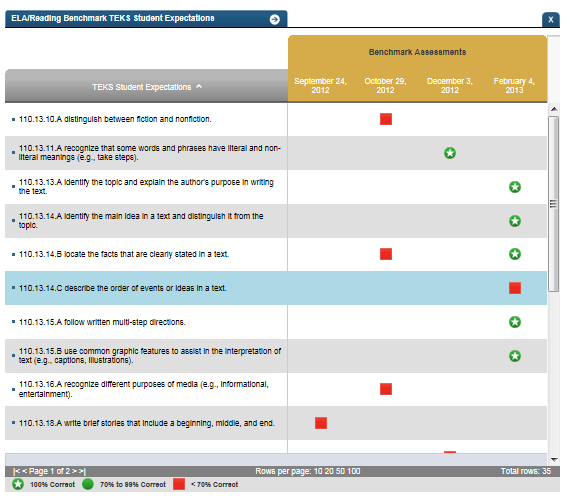
Figure 4 TSDS TEKS ELA/Reading Objective Detail
Business Rules
For the objective status, the system must display the following:
- Red square = The student did not answer correctly <70% correct if >1 question testing TEKS item
- Green circle = The student answered correctly >70% correct if >1 question testing TEKS item
- Green circle with white star = The student answered 100% of questions correctly testing TEKS item
Calculation Notes
If >1 question administered for a specific TEKS, if made <70%, will not count toward getting it correct
Tooltip
You can see the number of questions correct out of the number of questions tested for a TEKS item by hovering over its icon.