Dashboard Metrics


Campus Information
Background
Campus Dashboard Metrics
Educators require basic background information about a student before they even look at any other metrics. This sentiment was voiced again and again in forums with 2,600 educators across the state of Texas. Furthermore this information should be updated regularly to ensure that educators have the most accurate and up to date picture of the campus as a whole, especially in highly mobile districts.
User Interface
Dashboard Examples
Figure 1 shows the Campus Information page.
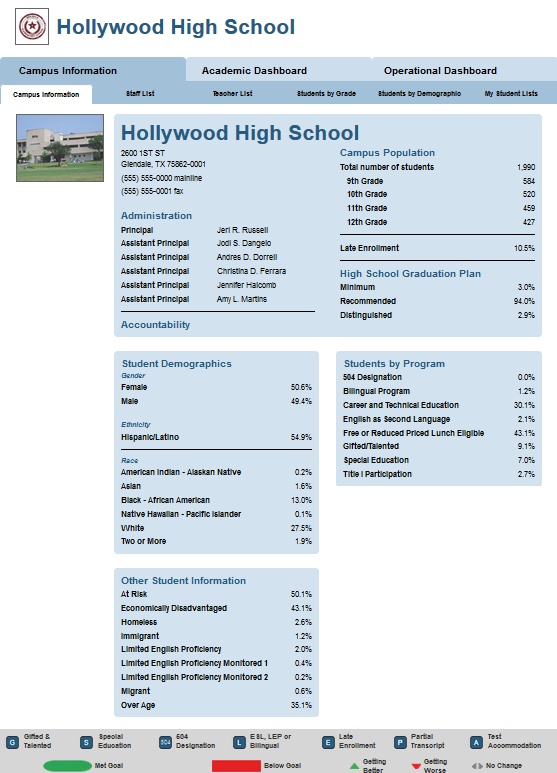
Figure 1 TSDS Campus Information Page
Status Definition
Status definition does not apply.
Trend Definition
Does not apply
Periodicity
To enable viewing of this metric as a leading indicator, the data must be updated and loaded frequently, at least weekly, though there is still some benefit from loading monthly.
Recommended Load Characteristics | |
Calendar | Weekly, Monthly |
Frequency of data load | Weekly |
Latency | 2-4 weeks |
Tooltips
The standard tool tips for the metric definition, column headers, and help functions display for this metric.
Business Rules
Data Source Assumptions
- The district student information system is the source system
- Feeder schools need to be identified
- Cohort year – needs to be defined for elementary and middle school campuses (default is 1st grade for K, 6th grade for MS)
Business Rules
| Data Element | Description | Interchange | Calculation Notes |
| Campus Name | CAMPUS-NAME identifies the name of the campus registered with the Texas Education Agency. | InterchangeEducationOrganization | |
| Cam pus Street Address | Campus Street Address identifies the street address registered with the Texas Education Agency. | InterchangeEducationOrganization | |
| Campus City | Campus City identifies the city in which the campus exists. This address is registered with the Texas Education. | InterchangeEducationOrganization | |
| Campus State | The Campus State identifies the state in which the campus exists. This element is registered with the Texas Education Agency. | InterchangeEducationOrganization | |
| Campus Zip Code | The Campus Zip Code identifies the zip code for the campus. This element is registered with the Texas Education Agency. | InterchangeEducationOrganization | |
| Campus Administration (Principals) | The Campus administrators, principals and assistant principals, are registered and maintained with the Texas Education Agency. | InterchangeStaffAssociationExtension | |
| Student Demographics | The Student Demographics identifies the student population gender, ethnicity and race. | InterchangeStudentEnrollmentExtension | |
| Student Population Gender | The Student Population Gender calculated percentage represents the student genders (male/female) submitted through PEIMS. | InterchangeStudentEnrollmentExtension | Total number of students with gender divided by the total student population |
| Student Population Race/Ethnicity | The Student Population Race/Ethnicity calculated percentage represents separate race and ethnicities submitted through PEIMS. | InterchangeStudentEnrollmentExtension | Total number of students per race/ethnicity divided by the total student population |
| School Population by Grade | The calculated Student Population by Grade represents the student population total by grade level. | InterchangeStudentEnrollmentExtension | Total number of students by grade |
| High School Graduation Plan by Type | Each student works toward a particular graduation plan (minimum, recommended, distinguished). The Graduation Plan percentages represent the student population on each of these prescribed plans. | InterchangeStudentEnrollmentExtension | Total number of students for identified plan divided by the total student population |
| Program Status | The program status is a calculated percentage that identifies the students in each program. | InterchangeStudentProgramExtension | Total number of students identified in the program divided by the total student population |
| Special Services | The Special Services calculated percentage identifies the population receiving the services. | InterchangeStudentProgramExtension | Total number of student using the service divided by the total student population |
| Late Enrollment | The Late Enrollment percentage represents the population of students identified as 'late'. | InterchangeStudentEnrollmentExtension |
Data Anomalies
Data Anomalies
- Metrics are sensitive to when and how often the data is loaded
- Late enrollees may have missing data
Frequency of Uploading Data
The metric computation implementation may vary depending on the periodicity of loading the data. For example, a daily load requires that you load data for only a single day (i.e., the last instructional day). Less frequent uploads require that you load data for each day since the date of the last load. For some metrics, failure to load daily will result in outdated data displayed in the Dashboards. It is recommended that LEAs set up the DTU to run daily in order to maintain the most up-to-date information in the Dashboards.
Implementation Considerations
Student Identity
Maintaining a correct and consistent student identity is at the center of any education data system. Most systems use some sort of unique identifier. However, sometimes this identifier is entered incorrectly or sometimes different systems use different identifiers. In Texas, the student identifier system at the state level is based upon Social Security Number with special considerations made for students without an SSN or when parents choose not to divulge their student's SSN. Most district student information systems in Texas rely on a local identifier that is unique only within the district.
The CDM XML supports the interchange of multiple types of identifiers. The StudentReference is a complex type within the CDM to maintain the referential integrity of the student (that is, ensuring that the data associated with each student is accurately associated with the right student). The complex type of the student reference assists with implementing the accurate matching algorithm to identify a student by utilizing any of the individual attributes (e.g., Student Unique State ID, Student ID, Campus Local ID (with Campus ID), Name and Birth Date). For example, if the Student Unique State ID is unknown, you can find the student’s identity by their Student ID, First Name, Last Name and Birth Date.
Source System Data Quality
The source system data must be in a state of completeness, validity, consistency, timeliness and accuracy that makes data appropriate for a specific use
Source System Data Mapping
Depending on dashboard use, in source systems some data elements are defined differently depending on whether they are used for accountability reporting or operational reporting (example: special education designations). It is important when mapping the data to work with business users to determine which are most widely used/accepted with users.
Human Resources
Staff data may reside in a separate system.
Special Services
Special services / special education – speak to the fact that this data may reside in different systems. What was most important to educators was knowing any types of services that would affect classroom instruction.
FERPA and HIPPA
The general FERPA and HIPPA interpretation among states differs. Therefore, there is not a general understand or policy defining what is allowable for viewing by different roles. The district must define these policies. District users would need proper district credentials to assess student informtion under the FERPA and HIPPA regulations. The district must be able to and can ‘turn off’ particular elements that shouldn’t be visible for users and/or particular audiences.
Accountability
Campus information differing from state accountability reports for a district/campus. This is based on the fact that dashboards are updated and reflect the student population at the time of the last update whereas accountability reports are based on a snapshot of the student population as of a particular date and also may designate certain students for exclusion in these snapshot submissions.