Dashboard Metrics


TEKS Mastery by Core Subject Area
Background
Campus Dashboard Metrics
Benchmark assessments are assessments administered periodically throughout the school year, at specified times during a curriculum sequence, to evaluate students’ knowledge and skills relative to an explicit set of longer-term learning goals. The design and choice of benchmark assessments is driven by the purpose, intended users, and uses of the instruments. Many benchmark assessments are aligned with the state curriculum and standards. In Texas, the state standards are call the TEKS. When benchmark assessments are tied to the TEKS, educators are able to assess how much of the curriculum has been mastered. Benchmark assessment can inform policy, instructional planning, and decision-making at the classroom, school and/or district levels.
Primary Metric
- TEKS Mastery by Core Subject Area: the percentage of students mastering a given threshold of TEKS on a benchmark assessment.
User Interface
Dashboard Example
Figure 1 shows the Benchmark Assessment metric as seen on the campus dashboard.
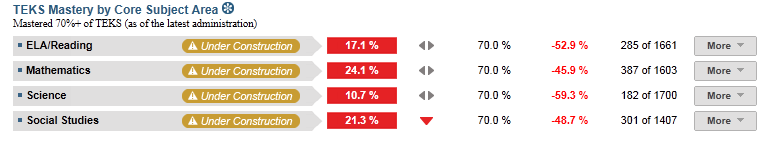
Figure 1 TSDS TEKS Mastery by Core Subject Area Metric
Status Definition on the Dashboard
The status indicator is determined by campus-specific thresholds (campus goals) which are set at the district level. The TSDS default threshold is 70% of students meeting the standard for each subject.
Metric Indicators | Comparisons | |||
Metric Name | Sub-metric Name | Metric Status Indicator | Trend | Campus Goal (Delta) |
TEKS Mastery by Core Subject Area | ELA/Reading | Red (Percentage) = if percentage of students who mastered less than 70% of the TEKS is greater than the campus goal Green (Percentage) = if percentage of students who mastered greater than or equal to 70% of TEKS is greater than the campus goal | Campus goal and the calculated percentage of students meeting the mastery standard | |
Mathematics | Red (Percentage) = if percentage of students who mastered less than 70% of the TEKS is greater than the campus goal Green (Percentage) = if percentage of students who mastered greater than or equal to 70% of TEKS is greater than the campus goal | Campus goal and the calculated percentage of students meeting the mastery standard | ||
Science | Red (Percentage) = if percentage of students who mastered less than 70% of the TEKS is greater than the campus goal Green (Percentage) = if percentage of students who mastered greater than or equal to 70% of TEKS is greater than the campus goal | Campus goal and the calculated percentage of students meeting the mastery standard | ||
Social Studies | Red (Percentage) = if percentage of students who mastered less than 70% of the TEKS is greater than the campus goal Green (Percentage) = if percentage of students who mastered greater than or equal to 70% of TEKS is greater than the campus goal | Campus goal and the calculated percentage of students meeting the mastery standard | ||
(a) For each subject, the Value column displays the number of students who have gotten 70% or more of cumulative TEKS correct as of the latest administration / the number of students who have taken at least one benchmark assessment
Trend Definition
Trend Indicators: Objective is to indicate TEKS Mastery | |||
| Up green | If the value for the current time frame is more than 5 percentage points higher than the prior time frame, then display a gray arrow trending upward. | |
| Unchanged | If the value for the current time frame is less than or equal to 5 percentage points higher or less than or equal to 5 percentage points lower, then display two gray arrows pointing outward indicating no direction. | |
| Down red | If the value for the current time frame is more than 5 percentage points lower than the prior time frame, then display a gray arrow trending downward. | |
The trend does not show for the first occurrence of a time frame since data is not available.
Delta Definition
The Delta column displays the absolute value of the difference between the campus percentage (Status column) and the campus goal percentage (Campus Goal column).
Delta Indicators: Objective is to indicate TAKS Performance | |||
Metric Name | Sub-Metric Name | Campus Goal | Delta |
TEKS Mastery | ELA/Reading | Set campus goal | Red (Delta Percentage) = if the campus TEKS mastery percentage is less than the campus goal Black (Delta Percentage) = if the campus TEKS mastery percentage i s equal to or gr eate r than the campus goal |
Mathematics | Set campus goal | Red (Delta Percentage) = if the campus TEKS mastery percentage is less than the campus goal Black (Delta Percentage) = if the campus TEKS mastery percentage is equal to or greater than the campus goal | |
Science | Set campus goal | Red (Delta Percentage) = if the campus TEKS mastery percentage is less than the campus goal Black (Delta Percentage) = if the campus TEKS mastery percentage is equal to or greater than the campus goal | |
Social Studies | Set campus goal | Red (Delta Percentage) = if the campus TEKS mastery percentage is less than the campus goal Black (Delta Percentage) = if the campus TEKS mastery percentage is equal to or greater than the campus goal | |
Periodicity
Table 5 Recommended Load Characteristics for
TEKS Mastery by Core Subject Area Metric
Recommended Load Characteristics | |
Calendar | Throughout the Year |
Frequenc y of data load | Twice a year |
Latency | School Year |
Interchange schema | Interchange-StudentAssessment.xsd |
Tooltips
The standard tool tips for the metric definition, column headers, and help functions display for this metric.
- Green metric status: OK
- Red metric status: LOW
- 'More' indicates drill down views for this metric
 is ‘No change from the prior period'
 is ‘Getting worse from the prior period’
 is 'Getting better from the prior period'
Data Anomalies
Anomalies
- If a student transfers from another district and has not taken the test, "N/A" displays and the late enrollment icon displays.
- TEKS are sent with data files from districts. If these are missing, the data will not display.
- Data shows only current year TEKS.
Footnotes
Footnotes are used to provide addition information concerning the metric. Footnotes are sequential for the entire page. Therefore, a metric's footnote may not begin with the number 1.
The following footnotes display below the metric:
- Label or footnote the student's grade level for the displayed TEKS results.
List number of classrooms with no benchmark or TEKS level data.
Implementation Considerations
Benchmark Assessment Identification
The district or the assessment vendor must identify the following base components from the enumerated set of data: test type, grade level, subject, classroom/section, campus and date of administration.
Types of Interim Assessments
TSDS metrics refer to "benchmarks," but these metrics may accommodate any district-wide formative assessment that is tied to a current state learning standard.
Drill Downs
The dashboards include the option to see more detail that is associated with a specific metric. Table 6 lists the drill down views that are recommended for this metric.
| Grade Level Chart | Graph of test assessment detail by grade level | |
| Student List | List of students who do not meet the threshold for this metric for the specified period. |
User Interface Notes
Dashboard Example
Figure 2 displays the TEKS Mastery by Core Subject Area.
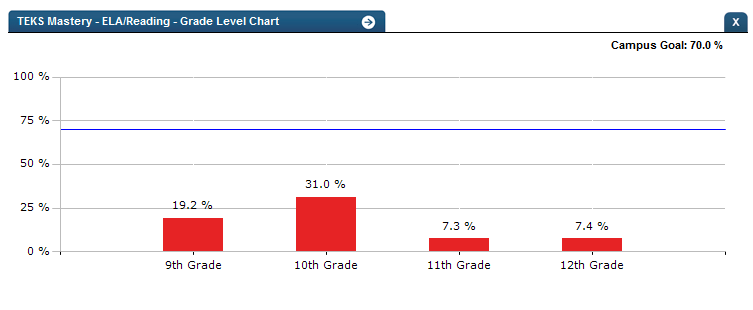
Figure 2 TSDS TEKS Masteryby Core Subject Area Grade Level Chart
Business Rules
- The current and prior year TEKS are displayed under each subject area.
- The percentage TEKS mastered may change from assessment administration to assessment administration.