Dashboard Metrics


Overview
Background
District Overview
The District Academic Dashboard Overview page displays the FERPA-compliant dashboard, including high-level categorized metric status information.
User Interface
Dashboard Example
Figure 1 shows the Dashboard Overview metric as seen on the district dashboard.
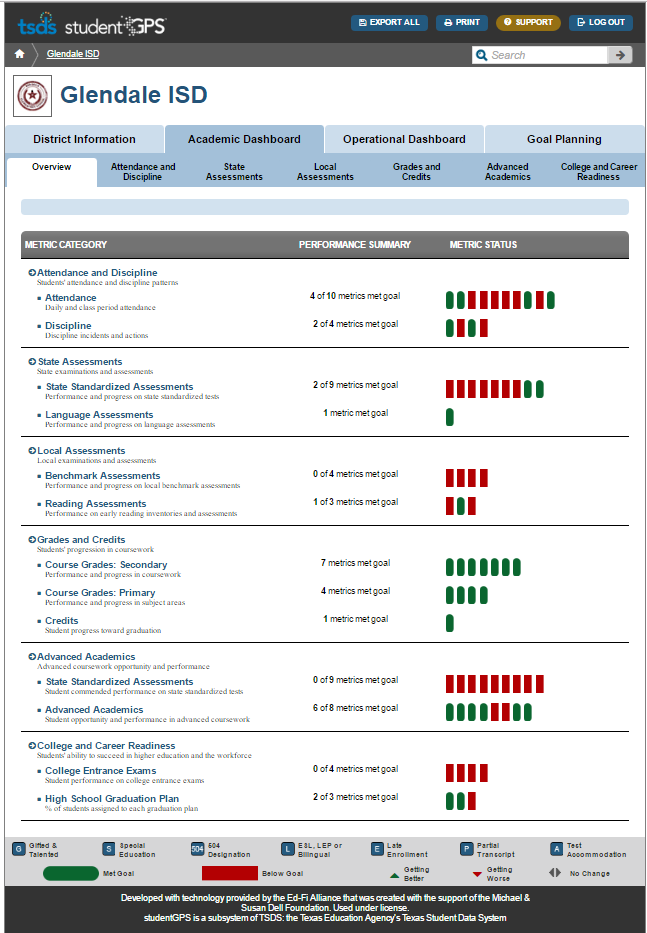
Figure 1 TSDS District Overview Page
Status Definition
- Each Status Indicator is associated with an individual metric, such as under Attendance and Discipline. Each 'tic tac' maps to Average Daily Attendance, Daily Attendance Rate, Days Absent, etc.
- If a metric meets the ”green” status threshold, it will have a “green” status (rounded) on the Overview page.
- If a metric meets the “red” status threshold, it will have a “red” status (rectangular) on the Overview page.
- On hover-over, the tool tip will display the metric name, description and status
Academic Dashboard Category Summary View
- The Overview section displays the container-level metrics in the following categories: Attendance and Discipline, Assessments, Grades and Credits, Advanced Academics (secondary only) and College and Career Readiness (secondary only).
- Each metric calculated within the category is displayed as a 'tic tac'.
- Users can navigate to the detailed data for each metric by clicking on the relevant metric category or 'tic tac'.
Business Rules
- Descriptions of each indicator are predefined based on the metric description.
- Metric category shall display regardless of the presence or absence of data for each.
- The presence or absence of a 'tictac' reflects the availability of metric data for the specific metric.
- Metric categories are predefined and cannot be added or deleted as a result of data being loaded.
Data Anomalies
Accountability Data
District metric values may differ from state accountability reports for a district. Dashboards are updated and reflect the student population at the time of the last update whereas accountability reports are based on a snapshot of the student population as of a particular date and also may designate certain students for exclusion in these snapshot submissions.
Frequency of Uploading Data
The metric computation implementation may vary depending on the periodicity of loading the data. For example, a daily load requires that you load data for only a single day (i.e., the last instructional day). Less frequent uploads require that you load data for each day since the date of the last load. For some metrics, failure to load daily will result in outdated data displayed in the Dashboards. It is recommended that LEAs set up the DTU to run daily in order to maintain the most up-to-date information in the Dashboards.