Dashboard Metrics


Grades Below C Level
Background
District Dashboard Metrics
Because of the need to closely monitor course performance, many school districts across the nation, including Chicago, Dallas and New York, have incorporated metrics on course performance and associated credit accumulation into their internal performance management dashboards. During focus groups conducted with over 2,600 educators throughout Texas, the Grades Below C Level metric was considered useful by 89 percent of those surveyed. By comparison, the Grades Below C Level metric when reported at the student level was considered useful by 92% of respondents.
Primary Metric
- Class Grades Below C Level: percent of students with two or more course grades below C for the most recent grading period.
User Interface
Dashboard Example
Figure1 shows the Grades Below C Level metric as seen on the district dashboard.
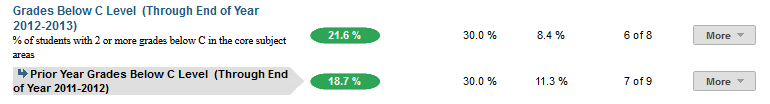
Figure 1 TSDS Grades Below C Level Metric
Status Definition
The Status metric identifies the percentage of students with a specified number of grades below C (numeric grades less than 75 and letter grades as D or F) in the last reported grading period, as follows:
The Status indicator is determined by campus-specific thresholds (campus goals) which are set at the district level. The threshold value is configurable and default values for the metric is 30%.
Table 2 defines the Status indicators. The calculated percentage is displayed with the indicator.
Metric Status Indicator | ||
Metric Name | Metric Status Indicator | District Goal (Delta) |
| Grades Below C | Red (Percentage) = if percentage of students with 2 course grades below C is greater than or equal to district goal Green (Percentage) = if percentage of students with 2 course grades below C is less than district goal | District goal and the calculated percentage of students with 2 course grades below C |
(a) The Value column displays the number of students with the specified number of grades below C out of the total number of students.
Trends
Currently the dashboards do not support trends for this district metric. The UI supports trends, but the ETL packages have not been developed.
Trend Definition
Trend Indicators: Objective is to indicate Course Grades Below C Level | |||
| Up green | If the value for the current time frame is more than 5 percentage points higher than the prior time frame, then display a gray arrow trending upward. | |
| Unchanged | If the value for the current time frame is less than or equal to 5 percentage points higher or less than or equal to 5 percentage points lower than the prior time frame, then display two gray arrows pointing outward indicating no direction. | |
| Down red | If the value for the current time frame is more than 5 percentage points lower than the prior time frame, then display a gray arrow trending downward. | |
The trend does not show for the first occurrence of a time frame since data is not available.
Delta Definition
The Delta column reflects the absolute value of the difference between the campus percentage (Status column) and the district goal percentage (District Goal column).
Delta Indicators: Objective is to indicate Repeated Courses | ||
Metric Name | District Goal | Delta |
Grades Below C | Set district goal | Red (Delta Percentage) = if the student grades below C percentage is more than the district goal Black (Delta Percentage) = if the students grades below C percentage is less than the district goal |
Periodicity
The data is most actionable when loaded at the end of each grading period after grades are posted. Grading periods vary by state and district. In Texas, grading periods are typically six or nine weeks.
Recommended Load Characteristics | |
Calendar | Throughout the school year |
Frequency of data load | Once each grading period |
Latency | 6-9 weeks |
Interchange schema | Interchange-StudentGrade.xsd |
Tooltips
The standard tool tips for the metric definition, column headers, and help functions display for this metric.
- Green metric status: OK
- Red metric status: HIGH
- 'More' indicates drill down views for this metric
 is ‘No change from the prior period'
 is ‘Getting worse from the prior period’
 is 'Getting better from the prior period'
Business Rules
The Grades Below C Level metric identifies the percentage of students performing below a C for two or more courses, for the most recent grading period in the current academic year:
- For letter grades, below C is defined as a D or F
- For numeric grades, below C is defined as below a configurable threshold (default < 75)
The metric must have at least one completed grading period of information; the metric is blank until the first grading period is completed and grades are recorded.
The length of the grading period is configurable and is defined by the district—typically either 6 or 9 weeks. The final grades are used once they are entered.
Data Assumptions
- Course grades are numeric or letter-based.
- District has set the value that drives the campus goals.
Computed Values
The cohort is the set of current students for whom grades have been loaded for the last reported grading period. The cohort includes students of all grades at all middle and high school campuses and excludes transfer students (late enrollment) for whom a grade is not available for the last reported grading period.
The metric value is the percentage of students that have two ore more course grades below C for the last grading period.
Table 6 defines how values on the district dashboard are calculated. The result of the calculation displays in the Status column on the dashboard.
Metric | Calculation |
Grades below C level | Number of students in cohort with two course grades below C for the latest reported grading period * 100 / Total students in cohort |
Data Anomalies
Footnotes
An icon appears next to any metric where students have been excluded. When the user hovers over the icon, count of students who have been excluded appear in a tooltip with the reason(s) for exclusion. By clicking on the icon, the data administrator will link to the data administrator’s page for more detail.
Best practice is to exclude and footnote students based on the following criteria:
- Missing data
Date of Refresh
Best practice is for the date of last data refresh to appear next the metric in the following format: (Through Third Grading Period).
Implementation Considerations
Late Enrollments or Missing Transcript Information
Students who transferred or enrolled late or students with incomplete data in their course transcript from the previous grading period are not included in the cohort.
Numeric or Letter Grading System
Best practice is for the metric to support both numeric and letter grading systems.
Drill Downs
Drill Down Views
The dashboards include the option to see more detail that is associated with a metric. Table 7 lists the drill down views that are recommended for this metric.
Campus List | List of campuses and whether or not they are meeting their goals for this metric for the specified period. |