Dashboard Metrics


Failing Subject Area Course Grades
User Interface
Dashboard Example
Figure 1 shows the Failing Subject Area Grades metric as seen on the district dashboard.
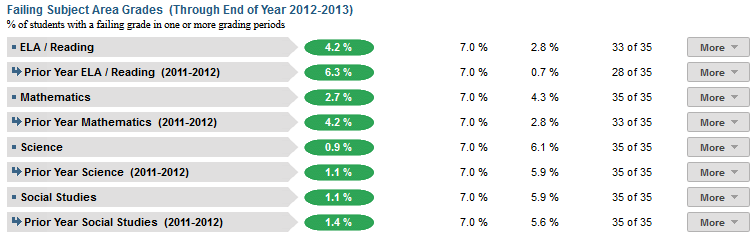
Figure 1 TSDS Failing Subject Area Grades Metric
Status Definition on the Dashboard
Metric Indicator | |||
Metric Title | Metric Sub-metric | Metric Status Indicator | Delta |
| Failing Subject Area Grades | ELA/Reading | Red = (Percentage) = if percentage of students failing ELA/Reading is greater than or equal to the goal (default is 5%). Green = (Percentage) = if percentages of students failing ELA/Reading is less than the goal (default is 5%). | The difference between the District Goal and the calculated percentage of students failing the subject area course. |
Mathematics | Red = (Percentage) = if percentage of students failing Mathematics is greater than or equal to the goal (default is 5%). Green = (Percentage) = if percentages of students failing Mathematics is less than the goal (default is 5%). | The difference between the District Goal and the calculated percentage of students failing the subject area course.
| |
Science | Red = (Percentage) = if percentage of students failing Science is greater than or equal to the goal (default is 5%). Green = (Percentage) = if percentages of students failing Science is less than the goal (default is 5%). | The difference between the Ditrict Goal and the calculated percentage of students failing the subject area course. | |
| Social Studies | Red = (Percentage) = if percentage of students failing Social Studies is greater than or equal to the goal (default is 5%). Green = (Percentage) = if percentages of students failing Social Studies is less than the goal (default is 5%). | The difference between the District Goal and the calculated percentage of students failing the subject area course. | |
Trends
Currently the Dashboards do not support trends for this district-level metric.
Periodicity
The data is most actionable when loaded at the end of each grading period after grades are posted. Grading periods vary by state and district. In Texas, grading periods are typically six or nine weeks.
Recommended Load Characteristics | |
Calendar | Throughout the school year |
Frequency of data load | Grading Period |
Latency | Grading Period |
Interchange schema | Interchange-StudentGrade.xsd |
Tooltips
The standard tool tips for the failing subject area grades metric definition, column headers, and help functions display for this metric.
The following are tooltips specific to the metric:
- "More" indicates drill down to view ‘Academic Profile’
 is ‘No change from the prior period'
 is ‘Getting worse from the prior period’
 is 'Getting better from the prior period'
Business Rules
Data Assumptions
- Student grade information is available for multiple grading periods for the current year. If the grade information is unavailable, the values is blank.
- Student grade information is available through the grade.
- Grades for each student are based on the latest grading period.
- Course grades are numeric or letter-based.
- District sets the value that drives the student thresholds (numeric and/or letter grade).
Data Anomalies
Anomalies
Best practice is to use footnotes to address these anomalies:
- Loading of data from each grading period
- Late enrollees may not have previous grading period grades from another school
- Missing transcripts for transfer students
Footnotes
Footnotes are used to provide addition data information concerning the metric. Footnotes are sequential for the entire page. Therefore, a metric's footnote may not begin with the number 1.
The following footnotes appear below the metric:
- Missing data
Date of Refresh
Best practice is for the date of last data refresh to appear next the metric in the following format:
- (Through Third Grading Period)
Implementation Considerations
Numeric or Letter Grading System
Best practice is for the metric to support both numeric and letter grading systems.
Late Enrollments
For late enrollment students, consider whether or not there is previous grading period data to compare to the latest grading period.
Frequency of Uploading Data
The metric computation implementation may vary depending on the periodicity of loading the data.
Current Grading Period
Data for the current grading period must exist for the Course Grades metric to exist.
Drill Downs
Drill Down Views
The dashboards include the option to see more detail that is associated with a specific metric. Table 7 lists the drill down views that are recommended for this metric.
| Campus List | List of campuses and whether or not they meet the threshold for this metric for the specified period. |