Dashboard Metrics


Tardy Rate
Background
District Dashboard Metrics
Because of the value of attendance as a key leading indicator of student performance, virtually every performance management dashboard should include a measure of student attendance or absenteeism. This need was echoed in focus groups conducted with over 2,600 Texas educators, in which student attendance was consistently named as one of three top data needs.
User Interface
Dashboard Example
Figure 1 shows the Tardy Rate metric as seen on the district dashboard.
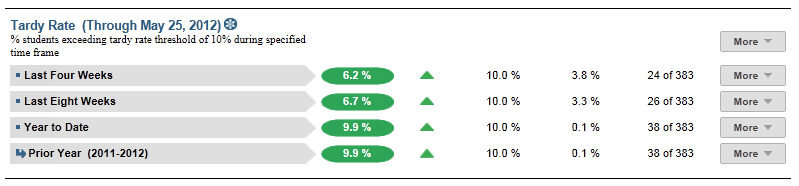
Figure 1 TSDS District Tardy Rate Metric
Status Definition
The Status indicator is determined by district goals. The default tardy thresholds set in the TSDS dashboards are as follows:
- Current and Previous time frames – 10% (2 days in 4 weeks)
- Year to Date – 10% (number of days eligible * 10% for YTD)
Metric Indicator | Trend Comparisons | |||
Metric Name | Sub-metric Name | Metric Status Indicator | Compares: | To: |
Tardy Rate | Last Four Weeks | Red (Percentage) = if Tardy Rate is greater than or equal to district goal Green (Percentage) = if Tardy Rate is less than district goal | Trend is not shown for the last four weeks | Trend is not shown for the last four weeks |
Year to Date | Red (Percentage) = if Tardy Rate is greater than or equal to district goal Green (Percentage) = if Tardy Rate is less than district goal | Trend is not shown for the year to date | Trend is not shown for the year to date | |
Trend
Currently the dashboards do not support trends for this district metric. The UI supports trends, but the ETL packages have not been developed.
Trend Definition
Table 3 lists the trend indicators for the Tardy Rate metric.
Trend Indicators: Objective is to indicate Daily Attendance Tardy Rate | |||
| Up green | If the value for the current time frame is more than 5 percentage points higher than the prior time frame, then display a gray arrow trending upward. | |
| Unchanged | If the value for the current time frame is less than or equal to 5 percentage points higher or less than or equal to 5 percentage points lower than the prior time frame, then display two gray arrows pointing outward indicating no direction. | |
| Down red | If the value for the current time frame is more than 5 percentage points lower than the prior time frame, then display a gray arrow trending downward. | |
Periodicity
Since tardy rate is a leading indicator of performance, best practice is to load this data on a frequent basis, at least weekly, though there is still some benefit from looking at it monthly.
Table 4 Recommended Load Characteristics for
Tardy Rate Metric
Recommended Load Characteristics | |
Calendar | Throughout the school year |
Frequency of data load | Weekly |
Latency | Monthly |
Interchange schema | Interchange-StudentAttendance.xsd |
Tooltips
The standard tool tips for the metric definition, column headers, and help functions display for this metric.
The following are tooltips specific to the Tardy Rate metric:
- Green metric status: OK
- Red metric status: HIGH
- 'More' indicates drill down to views for this metric
 is ‘No change from the prior period'
 is ‘Getting worse from the prior period’
 is 'Getting better from the prior period'
Business Rules
This is a roll-up of students who exceed the tardy threshold divided by total students currently enrolled for the following time frames:
- Last Four Weeks
- Year to Date
The length of each time frame is configurable and is defined by the district.
Data Assumptions
- Campuses must record student tardies at the classroom level for a time frame.
- The class or period when a student is counted as tardy is defined.
- District sets the value that drives the district threshold.
- Tardy rate data is available.
Computed Values
Table 5 shows defines how values are calculated for each time frame. The result of the calculation displays in the Status column on the campus dashboard.
Metric Values | ||
Tardy Rate | Last Four Weeks | Days Tardy = (Number of instructional days in last four weeks) – (Total number of student tardies in the last four weeks) |
Percentage = (Days Tardy / Number of instructional days in the last four weeks) * 100 | ||
Year to Date | Days Tardy = (Total number of instructional days in year to date) – (Total number of student tardies in year to date) | |
Percentage = (Days Tardy / Total number of instructional days in year to date) * 100 | ||
Calculation Notes
- If a student is not enrolled for some number of days, subtract those days from the “Total Number of Instructional Days” in both the numerator and the denominator.
- A tardy is computed from attendance in a specified class (section), homeroom, or period.
- If the current time frame is the first occurrence of the time frame of the school year, the previous time frame is grayed-out.
Data Anomalies
Footnotes
- Students transferring in that have not been present for a full grading period should be noted by a designated icon or other footnote.
- Metrics are sensitive to when and how often the data is loaded.
- Late enrollees are likely missing tardy and discipline data.
Date of Refresh
Best practice is for the date of last data refresh to appear next the metric in the following format:
- (Through April 2010)
Implementation Considerations
Designation of Campus Rule for Tardy Rate
Elementary and Middle schools typically designate a specific class (e.g., homeroom), or a time or class period on which to base tardy rate. This campus-specific business rule needs to be captured in order to properly interpret tardy rate from section attendance data.
Late Enrollments
For late enrollment students, subtract the days the student was not enrolled in a time frame (i.e., last 4 weeks, last eight weeks, or year-to-date).
Classification of Days as Non-Instructional Days
For the computation of the number of instructional days, developers can use either the total count of instructional days in a time frame or utilize the school calendar to identify specific instructional days for the time frame as the denominator for the percentage. The latter is a more accurate approach to calculating the metric with the caveat that it requires frequent uploading of data throughout the school year.
Frequency of Uploading Data
The metric computation implementation may vary depending on the periodicity of loading the data. For example, a daily load requires that you load data only for a single day (i.e., the last instructional day). Less frequent uploads require that you load data for each day since the date of the last load.
Length of Time Frames
The choice of four and eight weeks and year to date in TSDS is based on educator input, but the length of each time frame is configurable at the district level.
Trend
The metric assumes that only the current year’s tardy data is loaded. In this case, if the current time is the
- First time frame, there is no trend for current time frame and no trend for previous time frame.
- Second time frame, there is no trend for the previous time frame.
If the previous year’s tardy data is loaded, you have the option to compare to the previous years' time frames.
Best practice is for the district to establish a precision policy on what determines no change (e.g., ±5 percentage points).
Thresholds
Best practice is to set the thresholds for each campus at the district level. A secure mechanism is required to allow the district to set and maintain those thresholds.
Drill Downs
Drill Down Views
The dashboards include the option to drill down and see more detail that is associated with a metric. Table 6 lists the drill down views that are recommended for this metric.
| Campus List | List of all campuses for this metric for the specified period. |