Dashboard Metrics


Teacher Experience
Background
District Dashboard Metrics
Teachers play a huge role in the success of students. Districts and campuses must ensure that all campuses, including those that may be low-performing/high-need, have seasoned teachers. Additionally, in focus group discussions conducted with over 2,600 educators throughout Texas, the Teacher Experience metric was considered useful by 92% of respondents.
Primary Metric
- Teacher Experience: percentage of teachers with more than five years of professional teaching experience.
User Interface
Dashboard Example
Figure 1 shows the Teacher Experience list as seen on the operational dashboard.
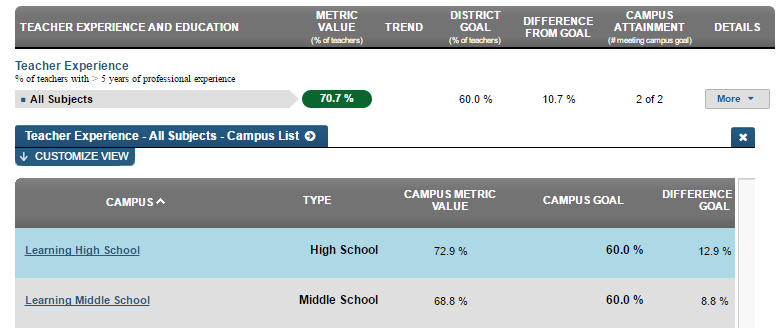
Figure 1 TSDS Teacher Experience
Figure 2 shows the Teacher Experience metric as seen on the district dashboard.
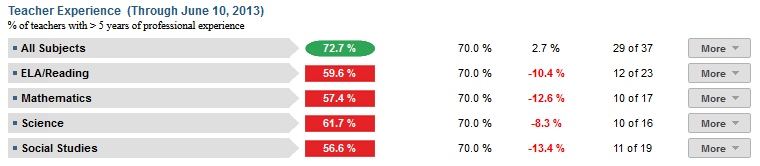
Figure 2 TSDS Teacher Experience
Status Definition
The Status indicator is determined by district goals. The TSDS default threshold = 60%.
Metric Indicator | |||
Metric Name | Sub-metric Name | Metric Status Indicator | Campus Attainment |
Teacher Experience | All Subjects | Red (Percentage) = percent of teachers with >5 years experience is less than district goal Green (Percentage) = percent of teachers with >5 years experience is equal to or greater than district goal | The number of campuses meeting their campus goal over the number of campuses with data for the metric |
ELA/Reading | Red (Percentage) = percent of teachers with >5 years experience is less than district goal Green (Percentage) = percent of teachers with >5 years experience is equal to or greater than district goal | The number of campuses meeting their campus goal over the number of campuses with data for the metric | |
Mathematics | Red (Percentage) = percent of teachers with >5 years experience is less than district goal Green (Percentage) = percent of teachers with >5 years experience is equal to or greater than district goal | The number of campuses meeting their campus goal over the number of campuses with data for the metric | |
Science | Red (Percentage) = percent of teachers with >5 years experience is less than district goal Green (Percentage) = percent of teachers with >5 years experience is equal to or greater than district goal | The number of campuses meeting their campus goal over the number of campuses with data for the metric | |
Social Studies | Red (Percentage) = percent of teachers with >5 years experience is less than district goal Green (Percentage) = percent of teachers with >5 years experience is equal to or greater than district goal | The number of campuses meeting their campus goal over the number of campuses with data for the metric | |
Trends
The dashboard does not currently support trends for this metric. The UI supports the trend, but the ETL package has not been developed.
Trend Definition
Trend Indicators: Objective is to indicate Teacher Experience | |||
| Up green | If the value for the current time frame is more than 5 percentage points higher than the prior time frame, then display a gray arrow trending upward. | |
| Unchanged | If the value for the current time frame is less than or equal to 5 percentage points higher or less than or equal to 5 percentage points lower than the prior time frame, then display two gray arrows pointing outward indicating no direction. | |
| Down red | If the value for the current time frame is more than 5 percentage points lower than the prior time frame, then display a gray arrow trending downward. | |
The trend does not show for the first occurrence of a time frame since data is not available.
Periodicity
Recommended Load Characteristics | |
Calendar | Throughout the school year |
Frequency of data load | Yearly, Semester (to account for teacher turnover) |
Latency | Year |
Interchange schema | Interchange-StaffAssociation.xsd |
Tooltips
The standard tool tips for the metric definition, column headers, and help functions display for this metric.
- Green metric status: OK
- Red metric status: LOW
- 'More' indicates drill down views for this metric
 is ‘No change from the prior period'
 is ‘Getting worse from the prior period’
 is 'Getting better from the prior period'
Business Rules
The Teacher Experience metric displays the percentage of teachers with more than five years of teaching experience, as of the end of the prior school year. The type of certifications that a teacher has is not considered, only the number of years teaching.
A teacher teaching more than one core course with more than five years experience is counted in all applicable subjects.
Computed Values
Table 5 defines how values are calculated for each sub-metric. The result of the calculation displays in the Status column on the district dashboard.
Metric Values | ||
Teacher Experience | All Subjects | Total number of teachers in the district with more than 5 years of teaching experience / Total number of teachers in the district currently teaching a course |
ELA/Reading | Total number of teachers in the district with more than 5 years of teaching experience and currently teaching ELA/Reading / Total number of teachers in the district currently teaching ELA/Reading | |
Mathematics | Total number of teachers in the district with more than 5 years of teaching experience and currently teaching mathematics / Total number of teachers in the district currently teaching mathematics | |
Science | Total number of teachers in the district with more than 5 years of teaching experience and currently teaching science / Total number of teachers in the district currently teaching science | |
Social Studies | Total number of teachers in the district with more than 5 years of teaching experience and currently teaching social studies / Total number of teachers in the district currently teaching social studies | |
Data Anomalies
Anomalies
- The teacher experience metric is calculated once per year at the beginning of the school year. Teachers who begin the school year with four years of teaching experience will not be reflected in this metric until the following school year.
Date of Refresh
Best practice is for the date of last data refresh to appear next the metric in the following format:
- (Through April 2010)
Implementation Considerations
Teacher Experience
This metric displays the number of teachers at a campus who have more than 5 years of experience teaching. The teacher's years of professional experience may not be in the same subject area that the teacher is currently teaching.
Drill Downs
Drill Down Views
The dashboards include the option to drill down and see more detail that is associated with a metric. Table 6 lists the drill down views that are defined for this metric.
| Campus List | List of campuses and whether or not they are meeting their goal for this metric for the specified period. |