Dashboard Metrics


Average Daily Attendance
Background
Because attendance is a key indicator of student performance, virtually every performance management dashboard should include a measure of student attendance. This need was echoed in focus groups conducted with over 2,600 Texas educators, in which student attendance was consistently named as one of three top data needs. Average Daily Attendance is one such measure.
Primary Metric
- Average Daily Attendance: the average daily attendance for all students with membership on campus during the current grading period and year to date.
User Interface
Dashboard Example
Figure 1 shows the Average Daily Attendance metric as seen on the campus dashboard.
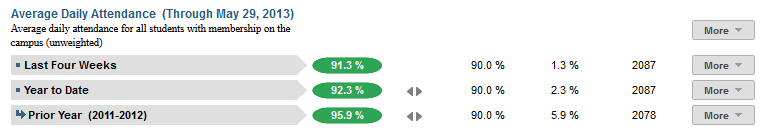
Figure 1 TSDS Average Daily Attendance Metric
Status Definition
The status indicator is determined by campus goals which are set at the district level. Each campus may have its own metric goal that aligns with campus performance targets. The default threshold would be 90% of the current enrollment.
Table 2 lists the status indicators and trend comparisons for Average Daily Attendance as seen on the campus dashboard.
Metric Indicator | Comparisons | |||
Metric Name | Sub-metric Name | Metric Status Indicator | Trend | Campus Goal (Delta) |
Average Daily Attendance | Current Grading Period | Red (Percentage) = if calculated Average Daily Attendance is less than campus goal. Green (Percentage) = if calculated Average Daily Attendance is greater than or equal to the campus goal. | Current and prior grading period | Campus goal and the calculated Average Daily Attendance |
Year to Date | Red (Percentage) = if calculated Average Daily Attendance is less than the campus goal Green (Percentage) = if calculated Average Daily Attendance is greater than or equal to the campus goal. | Trend compared to the same time period in prior year | Campus goal and the calculated Average Daily Attendance | |
(a) The Value column displays the average daily attendance represented by total students in membership on the campus.
Trend Definition
Table 3 lists the trend indicators for Average Daily Attendance metric.
Trend Indicators: Objective is to indicate Average Daily Attendance Rate | |||
| Up green | If the value for the current time frame is more than 5 percent higher than the prior time frame, then display a green arrow trending upward. | |
| Unchanged | If the value for the current time frame is less than or equal to 5 percent higher or less than or equal to 5 percent lower, then display two gray arrows pointing outward indicating no change. | |
| Down red | If the value for the current time frame is more than 5 percent lower than the prior time frame, then display a red arrow trending downward. | |
The trend for the Current Grading Period does not show until the first occurrence of a time frame since data is not available.
Delta Definition
Delta Indicators: Objective is to indicate Average Daily Attendance | |||
Metric Name | Sub-Metric Name | Campus Goal | Delta |
Average Daily Attendance | Last Four Weeks | Set Campus Goal | Red (Percentage) = if the calculated delta is less than the campus goal Black (Percentage) = if the calculated delta is equal to or greater than the campus goal |
Year to Date | Set Campus Goal | Red (Percentage) = if the calculated delta is less than the campus goal Black (Percentage) = if the calculated delta is equal to or greater than the campus goal | |
| Prior Year | Set Campus Goal | Red (Percentage) = if the calculated delta is less than the campus goal Black (Percentage) = if the calculated delta is equal to or greater than the campus goal | |
Recommended Load Characteristics | |
Calendar | Throughout the school year |
Frequency of data load | Daily, Weekly, Monthly |
Latency | Grading Period |
Interchange schema | InterchangeStudentAttendanceExtension.xsd |
Tooltips
The standard tooltips for the metric definition, column headers, and help functions display for this metric.
The following are tooltips specific to the Average Daily Attendance metric:
- Green metric status: OK
- Red metric status: LOW
- 'More' indicates drill down to view Historical Chart, Grade Level Chart, and Student List.
 is ‘No change from the prior period'
 is ‘Getting worse from the prior period’
 is ‘Getting better from the prior period'
Business Rules
The average daily attendance (ADA) is the total days of student attendance divided by the number of instructional days for the specified time period. It represents unweighted ADA. For example, a student attending every day would equal one ADA. TSDS ADA is an unweighted calculation.
ADA is not the same as enrollment, which is the number of students enrolled in a campus on a given day. ADA is usually lower than enrollment due to factors such as students moving, dropping out, or staying home due to illness. Students included in this metric are those considered to be in membership on a campus.
The Average Daily Attendance metric displays the average daily attendance for the following time frames:
- Current Grading Period
- Year to Date
- Prior Year
Middle and high schools typically designate a specific class period on which to base daily attendance. This class period is designated through the Homeroom Indicator.
When calculating this metric, the following additional rules apply:
- Both excused and unexcused absences are counted as an absence.
- A tardy or early release (if captured) is not counted as an absence.
- Days a student is not enrolled must be adjusted in the computation.
- The length of terms or grading periods is configurable and is defined by the district.
Data Assumptions
- Campus must record student absences for each time frame.
- The class or period when daily attendance is counted is specified.
- Student absences are categorized (e.g., excused, unexcused).
- District sets the value that drives the campus status thresholds.
Computed Values
Table 6 defines how values are calculated for each time frame. The result of the calculation displays in the Status column on the campus dashboard.
Metric Values | ||
Average Daily Attendance | Current Grading Period | sum of the each student's average daily attendance rate (# of days present / # of days in the current grading period) for those students with membership on the campus/total number of students currently enrolled |
Year to Date | sum of each student's average daily attendance rate (# of days present / # instructional days in the year as of current date) for those students with membership on the campus/total number of students currently enrolled | |
Calculation Notes
- A day of attendance is computed from attendance in a specified class (section), homeroom, or period designated through the Homeroom Indicator submitted in InterchangeStudentEnrollmentExtension.
- Both excused and unexcused absences are subtracted from total days.
- A tardy or early release (if captured) is not counted as an absence.
- Days the student is not enrolled is subtracted from total days.
- Length of the time frames may differ between elementary, middle, and high school since it is configurable and defined by district.
- The campus must define the campus goal each year. The TSDS default for both time frames is 90%.
Data Anomalies
- Metrics are sensitive to when and how often the data is loaded.
- Late enrollees are likely to be missing attendance data, but the calculation for daily attendance rate is not dynamic. Students are assumed to have been present all the days prior to enrollment.
- Infants and toddlers most likely do not have data to support any attendance metric.
- Early education and Pre-Kindergarten students with attendance data will not be included in Average Daily Attendance calculations because the metric is currently unweighted and cannot account for half-day and full-day specifications.
- Attendance data that is reported at the semester rather than grading periods cannot be included in this calculation. Students with a semester report are presumed to have 100% attendance which will skew the calculation.
- If the school calendar changes, adjust the denominator to reflect eligible days.
Best practice is to use footnotes to address these anomalies.
Footnotes
The following groups are excluded from this metric:
- Infants/toddlers
- Prekindergarten
- Students enrolled on a campus but not enrolled in any active sections.
Implementation Considerations
Designation of Campus Rule for Daily Attendance
Campuses typically designate a specific class (e.g., homeroom), or a time or class period on which to base daily attendance. The studentGPS® Dashboards use student attendance in this designated class period to calculate this attendance metric. If this period is not designated, the metrics will not appear.
Late Enrollment
The Dashboards do not currently adjust attendance rate metrics for late enrollment students. Attendance metrics may appear artificially low for these students.
Classification of Days as Non-Instructional Days
The number of instructional days in a designated period is derived from the campus calendar.
Frequency of Uploading Data
The metric computation implementation may vary depending on the periodicity of loading the data. For example, a daily refresh requires that you load data for only a single day (i.e., the last instructional day). Less frequent uploads require that you load data for each day since the date of the last load.
Length of Time Frames
The decision to show attendance metric values for specific time frames (e.g., Last Four Weeks) was based on educator input. However, these time frames are currently set at the system level and not configurable by a district.
Campus Goals
Metric goals at the campus level are set by district personnel with claim sets that provide access to the Goal Setting tab. District personnel should set campus goals in cooperation with campus administration with consideration of stated campus goals.
Notes
This metric excludes students enrolled on the campus but not taking classes. The number of excluded students is indicated upon hover-over of the asterisk.
Date of Refresh
Best practice is for the date of last data refresh to appear next the metric in the following format: (Through April 22, 2017). The date of refresh represents the most recent event date related to that metric that the school has loaded. The Average Daily Attendance refresh date represents the date of the most recent attendance event included in the metric calculation. If attendance is loaded daily, this refresh date will indicate the last successful data load.
Drill Downs
Drill Down Views
The dashboards include the option to drill down and see more detail that is associated with a metric. Table 7 lists the drill down views that are recommended for this metric.
| Grade Level | Graph of percent of students meeting the student threshold for the metric by grade level | |
| Historical | Graph of metric values across multiple time periods | |
| Student List | List of students who do not meet the student level threshold for the metric for the "specified timeframe" |
Dashboard Example
Figure 2 shows TSDS Grade Level Chart for Average Daily Attendance.
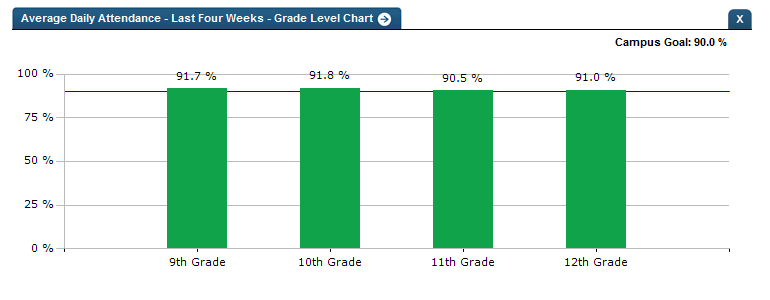
Figure 2 TSDS Average Daily Attendance Grade Level Chart
Business Rules
The Grade Level Chart allows the user to see student performance against a metric goal by grade level. This can be a useful tool for identifying specific grade levels that may be contributing disproportionately--either positively or negatively--to campus performance on this metric.
Dashboard Example
Figure 3 shows TSDS historical graph for Average Daily Attendance.
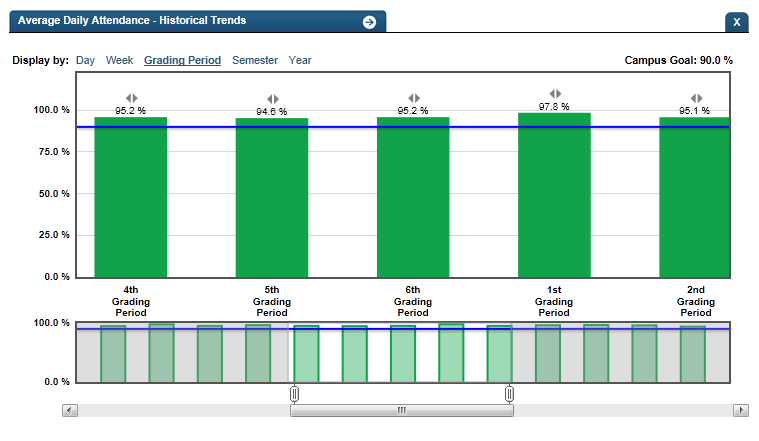
Figure 3 TSDS Average Daily Attendance Historical Chart
Business Rules
The Historical Graph allows the user to see historical data across multiple timeframes. As time passes, there are many bars to be displayed; therefore, the slider on the bottom allows the user to adjust the number of bars displayed as well as the time period shown. The timeframes for this metric were chosen based on educator feedback.
Daily attendance values are not retained for prior years; however, aggregate historical data is available.
Drill Down Tooltips
Grade Level Chart:
- The number of students enrolled in a specific grade who met the student goal (90%) out of the total number of students enrolled in that grade will display as you hover over the bars of the graph.
- Green bar = met the campus goal as applied to that grade level
- Red bar = did not meet the campus goal as applied to that grade level
Historical Chart:
- The start and end dates and the percent value of the metric for that time period are shown as you hover over a bar of the graph.
- The slider bar adjusts the number of time periods viewed in the graph.
- Green bar = student did meet the student goal
- Red bar = student did not meet the student goal