Dashboard Metrics


High School Graduation Plan
Background
District Dashboard Metrics
In order to monitor student progress toward completing more rigorous graduation requirements, many school districts across the nation, including New York and several districts in Texas, have incorporated into their internal performance management dashboards metrics on the distribution of students by graduation plan. In addition, during focus groups conducted with over 2,600 educators throughout Texas, the High School Graduation Plan metric was considered useful by 96% of those surveyed.
Although graduation requirements vary by state, the general principles applied in the district dashboard and data model for graduation plans is applicable to any state or district.
Primary Metric
- High School Graduation Plan: percent of students on each graduation plan (Minimum, Recommended or Distinguished in Texas), with comparison to campus goals for each.
User Interface
Dashboard Example
Figure 1 shows the High School Graduation Plan metric as seen on the district dashboard.
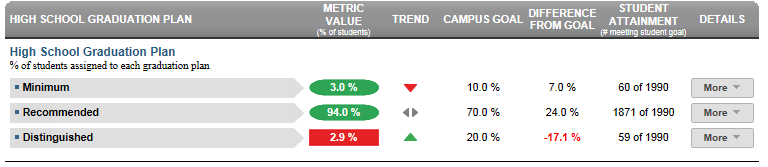
Figure 1 TSDS High School Graduation Plan Metric
Status Definition
The Status column indicates the percentage of current students across grades 9-12 targeting the three types of graduation plan options specified by the State of Texas, as follows:
- Minimum graduation plan
- Recommended graduation plan
- Distinguished achievement graduation plan
The Status indicator is determined by district goals. The TSDS default goals are
- Minimum Graduation Plan is 10%
- Recommended Graduation Plan is 70%
- Distinguished Achievement Graduation Plan is 20%
Table 2 lists the Status indicators as seen on the district dashboard.
Metric Indicators | |||
Metric Name | Sub-metric Name | Metric Status Indicator | Campus Attainment |
High School Graduation Plan | Minimum | Red (Percentage) = if the percentage of students is less than district goal Green (Percentage) = if the percentage of students is greater than or equal to district goal | The number of campuses meeting their campus goal over the number of campuses with data for the metric |
Recommended | Red (Percentage) if the percentage of students is less than district goal Green (Percentage) if the percentage of students is greater than or equal to district goal | The number of campuses meeting their campus goal over the number of campuses with data for the metric | |
Distinguished | Red (Percentage) = if the percentage of students is less than district goal Green (Percentage) = if the percentage of students is greater than or equal to district goal | The number of campuses meeting their campus goal over the number of campuses with data for the metric | |
Trends
The dashboards do not currently support trends for this metric. The UI supports the trends, but the ETL packages have not been developed.
Trend Definition
Table 3 defines the trend indicators for the Minimum High School Graduation Plan metric.
Trend Indicators: Objective is to indicate Minimum Graduation Plan | |||
| Up green | If the value for the current time frame is more than 5 percentage points higher than the prior time frame, then display a gray arrow trending upward. | |
| Unchanged | If the value for the current time frame is less than or equal to 5 percentage points higher or less than or equal to 5 percentage points lower than the prior time frame, then display two gray arrows pointing outward indicating no direction. | |
| Down red | If the value for the current time frame is more than 5 percentage points lower than the prior time frame, then display a gray arrow trending downward. | |
The trend does not show for the first occurrence of a time frame since data is not available.
Table 4 defines the trend indicators for the Recommended High School Graduation Plan metric.
Trend Indicators: Objective is to indicate Recommended Graduation Plan | |||
| Up green | If the value for the current time frame is more than 5 percentage points higher than the prior time frame, then display a gray arrow trending upward. | |
| Unchanged | If the value for the current time frame is less than or equal to 5 percentage points higher or less than or equal to 5 percentage points lower than the prior time frame, then display two gray arrows pointing outward indicating no direction. | |
| Down red | If the value for the current time frame is more than 5 percentage points lower than the prior time frame, then display a gray arrow trending downward. | |
The trend does not show for the first occurrence of a time frame since data is not available.
Table 5 defines the trend indicators for the Distinguished High School Graduation Plan metric.
Trend Indicators: Objective is to indicate Distinguished Graduation Plan | |||
| Up green | If the value for the current time frame is more than 5 percentage points higher than the prior time frame, then display a gray arrow trending upward. | |
| Unchanged | If the value for the current time frame is less than or equal to 5 percentage points higher or less than or equal to 5 percentage points lower than the prior time frame, then display two gray arrows pointing outward indicating no direction. | |
| Down red | If the value for the current time frame is more than 5 percentage points lower than the prior time frame, then display a gray arrow trending downward. | |
The trend does not show for the first occurrence of a time frame since data is not available.
Delta Definition
The delta appears only in the campus list and displays the individual campus goals rather than the district goal.
Delta Indicators: Objective is to indicate All Discipline Incidents Rate | |||
Metric Name | Sub-Metric Name | Campus Goal | Delta |
High School Graduation Plan | Minimum | Set campus goal | Red (Delta Percentage) = if the plan percentage is less than the campus goal Black (Delta Percentage) = if the plan percentage is equal to or greater than the campus goal |
Recommended | Set campus goal | Red (Delta Percentage) = if the plan percentage is less than the campus goal Black (Delta Percentage) = if the plan percentage is equal to or greater than the campus goal | |
Distinguished | Set campus goal | Red (Delta Percentage) = if the plan percentage is less than the campus goal Black (Delta Percentage) = if the plan percentage is equal to or greater than the campus goal | |
Periodicity
At minimum, load this information at the beginning of a school year to assess any interventions required.
Recommended Load Characteristics | |
Calendar | Each semester or at least yearly |
Frequency of data load | Twice a year |
Latency | 7-8 months |
Interchange schema | Interchange-StudentEnrollment.xsd |
Tooltips
The standard tool tips for the metric definition, column headers, and help functions display for this metric.
- Green metric status: OK
- Red metric status: LOW
- 'More' indicates drill down views for this metric
 is ‘No change from the prior period'
 is ‘Getting worse from the prior period’
 is 'Getting better from the prior period'
Business Rules
The High School Graduation Plan metric indicates the percentage of current students across grades 9-12 targeting the three types of graduation plan options specified by the State of Texas, as follows:
- Minimum graduation plan
- Recommended graduation plan
- Distinguished Achievement graduation plan
Data Assumptions
- All students are assigned a graduation plan for grades 9-12. If none is assigned, Recommended is the default.
Computed Values
The cohort is the set of currently enrolled students across all grades at the campus. If a student is not assigned a graduation plan, Recommended is the default.
Table 8 defines how values in the Status column are calculated. The result of the calculation displays in the Status column on the district dashboard.
| Metric | Calculation |
High School Graduation Plan | Total number of all campuses meeting their goal for the specific graduation plan * 100 / Total of all campuses |
Data Anomalies
Anomalies
- Transfer students will not be included in this metric until the student is assigned to a graduation plan.
Implementation Considerations
Graduation Plan Periodicity
Some districts automatically assign a default graduation plan to all students upon entry into high school. Counselors and other administrators update plan information as they work with students to define college and career goals, thus this metric changes more frequently during a school year – particularly in the later grades preceding graduation. In these and similar situations, loading this data more frequently is recommended.
Drill Downs
Drill Down Views
The dashboards include the option to see more detail that is associated with a metric. Table 9 lists drill down views that are recommended for this metric.
| Campus List | List of campuses and whether or not they meet their goal for this metric for the specified period. |