Dashboard Metrics


High School Graduation Plan
Background
The High School Graduation Plan metric at the campus level provides educators with information related to student participation in the legacy Texas high school graduation plans--Minimum High School Program (MHSP), Recommended High School Program (RHSP), or Distinguished Achievement Program (DAP). Students who entered high school before the 2014-2015 school year have the option of graduating on one of these plans or on the Foundation High School Program.
The metric shows the percent of students on each graduation plan, with comparison to campus goals for each.
User Interface
Dashboard Example
Figure 1 shows the High School Graduation Plan metric as seen on the campus dashboard.
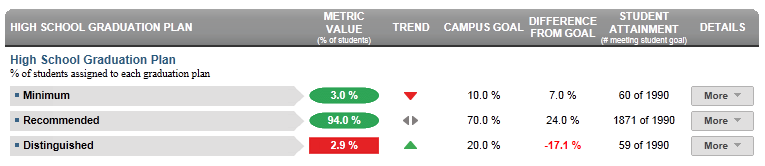
Figure 1 TSDS High School Graduation Plan Metric
Status Definition
The Status column indicates the percentage of current students across grades 9-12 targeting the three types of graduation plan options specified by the State of Texas, as follows:
- Minimum graduation plan
- Recommended graduation plan
- Distinguished achievement graduation plan
The Status indicator is determined by campus-specific thresholds (campus goals) which are set at the district level. The TSDS default thresholds are
- Minimum Graduation Plan is 10%
- Recommended Graduation Plan is 70%
- Distinguished Achievement Graduation Plan is 20%
Table 2 lists the Status indicators as seen on the campus dashboard.
Metric Indicators | Comparisons | |||
Metric Name | Sub-metric Name | Metric Status Indicator | Trend | Campus Goal (Delta) |
High School Graduation Plan | Minimum | Red (Percentage) = if the percentage of students is less than campus goal Green (Percentage) = if the percentage of students is greater than or equal to campus goal | Current year to prior year | Campus goal and the calculated percentage of students |
Recommended | Red (Percentage) if the percentage of students is less than campus goal Green (Percentage) if the percentage of students is greater than or equal to campus goal | Current year to prior year | Campus goal and the calculated percentage of students | |
Distinguished | Red (Percentage) = if the percentage of students is less than campus goal Green (Percentage) = if the percentage of students is greater than or equal to campus goal | Current year to prior year | Campus goal and the calculated percentage of students | |
(a) The Value column displays the number of students assigned a specific graduation plan out of the total number of students on campus.
Trend Definition
Table 3 defines the trend indicators for the Minimum High School Graduation Plan metric.
Trend Indicators: Objective is to indicate Minimum Graduation Plan | |||
| Up green | If the value for the current time frame is more than 5 percentage points higher than the prior time frame, then display a gray arrow trending upward. | |
| Unchanged | If the value for the current time frame is less than or equal to 5 percentage points higher or less than or equal to 5 percentage points lower than the prior time frame, then display two gray arrows pointing outward indicating no direction. | |
| Down red | If the value for the current time frame is more than 5 percentage points lower than the prior time frame, then display a gray arrow trending downward. | |
The trend does not show for the first occurrence of a time frame since data is not available.
Table 4 defines the trend indicators for the Recommended High School Graduation Plan metric.
Trend Indicators: Objective is to indicate Recommended Graduation Plan | |||
| Up green | If the value for the current time frame is more than 5 percentage points higher than the prior time frame, then display a gray arrow trending upward. | |
| Unchanged | If the value for the current time frame is less than or equal to 5 percentage points higher or less than or equal to 5 percentage points lower than the prior time frame, then display two gray arrows pointing outward indicating no direction. | |
| Down red | If the value for the current time frame is more than 5 percentage points lower than the prior time frame, then display a gray arrow trending downward. | |
The trend does not show for the first occurrence of a time frame since data is not available.
Table 5 defines the trend indicators for the Distinguished High School Graduation Plan metric.
Trend Indicators: Objective is to indicate Distinguished Graduation Plan | |||
| Up green | If the value for the current time frame is more than 5 percentage points higher than the prior time frame, then display a gray arrow trending upward. | |
| Unchanged | If the value for the current time frame is less than or equal to 5 percentage points higher or less than or equal to 5 percentage points lower than the prior time frame, then display two gray arrows pointing outward indicating no direction. | |
| Down red | If the value for the current time frame is more than 5 percentage points lower than the prior time frame, then display a gray arrow trending downward. | |
The trend does not show for the first occurrence of a time frame since data is not available.
Delta Definition
The Delta column is the absolute value of the difference between the metric percentage (Status column) and the campus goal percentage (Campus Goal column).
Delta Indicators: Objective is to indicate All Discipline Incidents Rate | |||
Metric Name | Sub-Metric Name | Campus Goal | Delta |
High School Graduation Plan | Minimum | Set campus goal | Red (Delta Percentage) = if the plan percentage is less than the campus goal Black (Delta Percentage) = if the plan percentage is equal to or greater than the campus goal |
Recommended | Set campus goal | Red (Delta Percentage) = if the plan percentage is less than the campus goal Black (Delta Percentage) = if the plan percentage is equal to or greater than the campus goal | |
Distinguished | Set campus goal | Red (Delta Percentage) = if the plan percentage is less than the campus goal Black (Delta Percentage) = if the plan percentage is equal to or greater than the campus goal | |
Periodicity
At minimum, load this information at the beginning of a school year to assess any interventions required.
Recommended Load Characteristics | |
Calendar | Each semester or at least yearly |
Frequency of data load | Twice a year |
Latency | 7-8 months |
Interchange schema | Interchange-StudentEnrollment.xsd |
Tooltips
The standard tool tips for the metric definition, column headers, and help functions display for this metric.
- Green metric status: OK
- Red metric status: LOW
- 'More' indicates drill down views for this metric
 is ‘No change from the prior period'
 is ‘Getting worse from the prior period’
 is 'Getting better from the prior period'
Business Rules
The High School Graduation Plan metric indicates the percentage of current students across grades 9-12 targeting the three types of graduation plan options specified by the State of Texas, as follows:
- Minimum graduation plan
- Recommended graduation plan
- Distinguished achievement graduation plan
Data Assumptions
- All students are assigned a graduation plan for grades 9-12. If none is assigned, Recommended is the default.
Computed Values
The cohort is the set of currently enrolled students across all grades at the campus. If a student is not assigned a graduation plan, Recommended is the default.
Table 8 defines how values in the Status column are calculated. The result of the calculation displays in the Status column on the campus dashboard.
| Metric | Calculation |
High School Graduation Plan | Total number of all current students with a specific plan * 100 / Total of all current students on campus |
Data Anomalies
Anomalies
- Transfer students will not be included in this metric until the student is assigned to a graduation plan.
Implementation Considerations
Default Graduation Plan
TSDS assumes a default graduation plan of Recommended. Alternatively,developers may list the percentage of students who do not have a graduation plan assigned as a separate data point.
Graduation Plan Periodicity
Some districts automatically assign a default graduation plan to all students upon entry into high school. Counselors and other administrators update plan information as they work with students to define college and career goals, thus this metric changes more frequently during a school year – particularly in the later grades preceding graduation. In these and similar situations, loading this data more frequently is recommended.
Campus Goals
Best practice is for developers to set goals for each campus at the district level. A secure mechanism is required to allow the district to set and maintain those goals.
Drill Downs
Drill Down Views
The dashboards include the option to see more detail that is associated with a metric. Table 9 lists drill down views that are recommended for this metric.
| Grade Level | Graph of metric values detail by grade level | |
| Historical | Graph metric values across multiple time periods. | |
| Student List | List students who do not meet the threshold for this metric for the specified period. |
User Interface
Dashboard Examples
Figure 2 shows the grade level charts for High School Graduation Plan as seen on the campus dashboard.
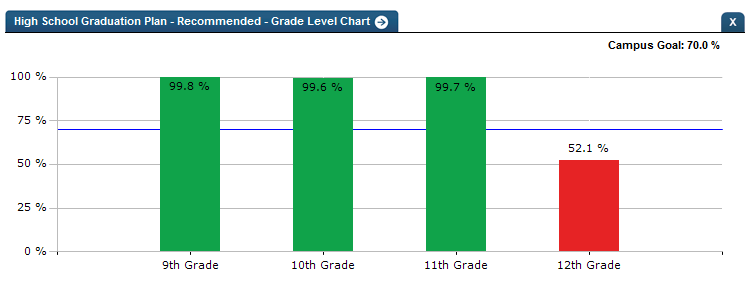
Figure 2 TSDS High School Graduation Plan Grade Level Chart
Figure 3 shows the historical chart for the High School Graduation Plan as seen on the campus dashboard.

Figure 2 TSDS High School Graduation Plan Historical Chart