Dashboard Metrics


Failing Subject Area Course Grades
Background
Student Dashboard Metrics
Because of the need to closely monitor course performance, many school districts across the nation, including Chicago, Dallas and New York, have incorporated metrics on course performance and associated credit accumulation into their internal performance management dashboards. In addition, during focus groups conducted with over 2,600 educators throughout Texas, the Class Grades metrics, which are the high school equivalent of subject area grades, were considered useful by 96% of those surveyed.
Primary Metric
- Failing Subject Area Course Grades: grades for each of the core subject areas for a student.
User Interface
Dashboard Example
Figure 1 shows the Subject Area Course Grades metric as seen on the student dashboard.
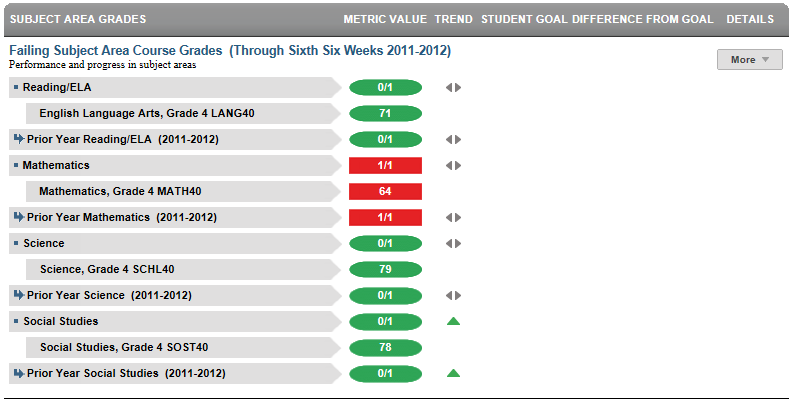
Figure 1 TSDS Subject Area Course Grades Metric
- If the prior year subject area grades are not available, the trend will not display.
Status Definition
The Status indicator is determined by campus-specific thresholds (campus goals) which are set at the district level. The default thresholds for passing/failing a course are defined in Table 2.
Table 2 Metric Status Indicator for TSDS Subject Area Course Grades
Metric Indicator | Trend Comparisons | |||
Metric Name | Sub-metric Name | Metric Status Indicator (a) | Compares: | To: |
Subject Area Course Grades | ELA/Reading | Red (Below) = One or more courses are failing (< 70) Green (Met Goal) = All grades are passing (E, S, N or > 70) | Subject grades for the current grading period | Subject grades for the prior grading period |
Mathematics | Red (Below) = One or more courses are failing (< 70) Green (Met Goal) = All grades are passing (E, S, N or > 70) | Subject grades for the current grading period | Subject grades for the prior grading period | |
Science | Red (Below) = One or more courses are failing (> 70) Green (Met Goal) = All grades are passing (E, S, N or > 70) | Subject grades for the current grading period | Subject grades for the prior grading period | |
| Social Studies | Red (Below) = One or more courses are failing (> 70) Green (Met Goal) = All grades are passing (E, S, N or > 70) | Subject grades for the current grading period | Subject grades for the prior grading period | |
(a) The Value column displays the actual grade (letter or numeric) in the subject.
Trend Definition
In the full DCD implementation, if the first grading period is not complete, TSDS shows prior year with final grades for each subject. When the first grading period is complete, the trend shows the difference between first grading period and final year grade from the prior year.
Table 3 lists the trend indicators.
Trend Indicators: Objective is to indicate Course Grades | |||
| Up green | If the subject area grade status was "not met" (failing) in the prior grading period and is "met " in the current grading period | |
| Unchanged | If there is no change in the subject area grade status. | |
| Down red | If the subject area grade status was "met" in the prior grading period and "not met" (failing) in the current grading period | |
Trends do not display for the first grading period as data is not available.
Trends do not display if data is available for less than two grading periods.
Periodicity
The data is most actionable when loaded at the end of each grading period after grades are posted. Grading periods vary by state and district. In Texas, grading periods are typically six or nine weeks.
Recommended Load Characteristics | |
Calendar | Throughout the school year |
Frequency of data load | Grading period |
Latency | Grading period |
Interchange schema | Interchange-StudentGrade.xsd |
Tooltips
The standard tool tips for the Subject Area Course Grade metric definition, column headers, and help functions display for this metric.
The following are tooltips specific to the Subject Area Course Grades metric:
- Green metric status: OK
- Red metric status: Not Met
- 'More' indicates drill down for this metric
 is ‘No change from the prior period.’
 is ‘Getting worse from prior period.'
 is ‘Getting better from prior period.'
Business Rules
The Failing Subject Area Course Grade metric indicates how well a student is doing in their subject area courses during the current school year. TSDS must be able to interpret any type of elementary school grade (such as numeric or letter) and convert the grade in order to determine whether or not the grade is failing.
Failing grades are reported for courses in the following subject areas:
- Reading/ELA
- Mathematics
- Science
- Social Studies
Data Assumptions
- Student grade information is available for multiple grading periods for the current year. If the grade information is unavailable, the values are blank.
- Student grade information is available throughout the grade level.
- Grades for each student are based on the latest grading period.
- Course grades are numeric or letter-based.
- District sets the value that drives the student thresholds for pass/fail (numeric and/or letter grade).
Computed Values
The high-level metric displays the number of grades failing out of the total number of grades for that particular subject area. The submetrics display the course titles and the actual grades for each course and therefore will have no computed values.
Data Anomalies
Anomalies
Best practice is to footnote these anomalies:
- Loading of data from each grading period
- Late enrollees may not have previous grading period grades from another school
- Missing transcripts for transfer students.
- If a grade level only gives grades for part of the year (i.e. first graders receive grades starting in January), several things may appear odd on the dashboards. First the current courses may change mid-year for these students once the grade book changes. Second, the campus and district metrics may change dramatically mid-year to include these new students.
Footnotes
- Best practice is to note late enrollee students that have not been present for a full grading period
- Missing transcripts for transfer students
Date of Refresh
Best practice is for the date of last data refresh to appear next the metric in the following format:
- (Through Second Six Weeks)
Implementation Considerations
Attendance and Grade Metrics for Elementary School
TSDS uses a student's assignment to formal class periods to determine both attendance and grades. Most elementary schools do not have a standard methodology for capturing attendance data. A teacher may take attendance in the classroom, but not formally record it. The same is true for grades, especially in kindergarten and first grade. In most cases, TSDS metrics will not display attendance data for these grade levels and grades may not display in the metrics until the end of the year, if at all.
Numeric or Letter Grading System
Best practice is for the metric to support both numeric and letter grading systems.
Late Enrollments
For late enrollment students, consider whether or not there is previous grading period data to compare to the latest grading period.
Frequency of Uploading Data
The metric computation implementation may vary depending on the periodicity of loading the data.
Current Grading Period
Data for the current grading period must exist for the course grades metric to exist.
Courses with the Same Title but Different Course Codes
It is possible to have courses withe the same title but different course codes. If the student is currently enrolled in both courses and has grades for both courses then both should display. The display should read 'Course title - Course code"
Drill Downs
Drill Down Views
The dashboards include the option to see more detail that is associated with a specific metric. Table 5 lists the drill down views that are recommended for this metric.
Table 5 Subject Area Course Grades Drill Down View
| Current Courses | Current courses as displayed on the transcript. |
Dashboard Example
Figure 2 shows current courses for the Failing Subject Area Course Grades metric as seen in the TSDS dashboards.
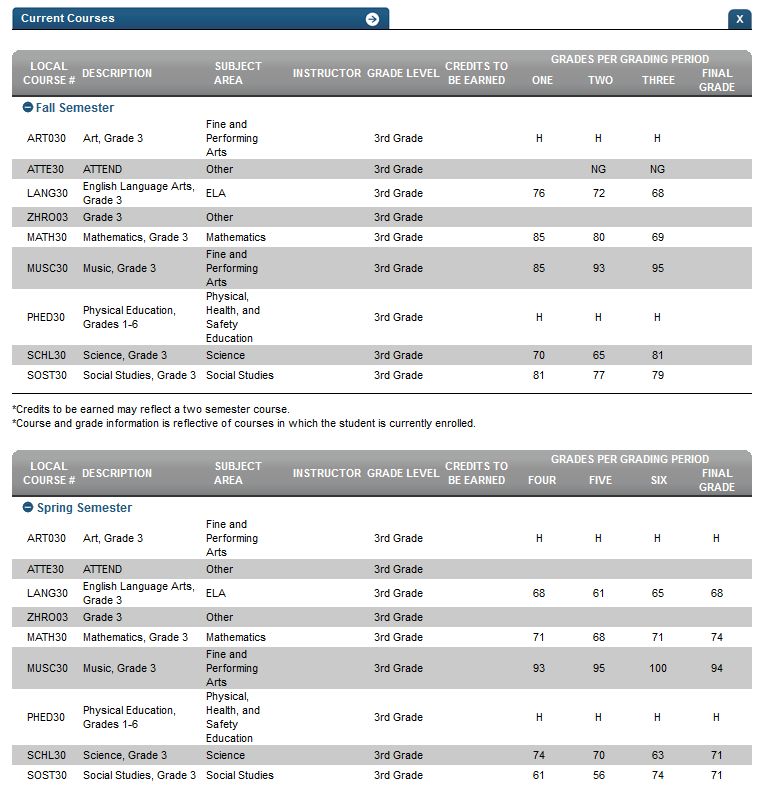
Figure 2 TSDS Failing Subject Area Course Grades - Current Courses