Dashboard Metrics


Days Absent
Background
Campus Metric
Days absent is a metric requested by many users nationally. Users want to be able to see the cumulative number of days a student has been absent and a breakdown of excused vs. unexcused absences. In many districts, a student acquiring their tenth unexcused absence for the year triggers a variety of actions from teachers and administrators. This metric will display the percentage of students with 8 or more absences year to date on the campus.
Primary Metric
- Days Absent: The percentage of students with 8 or more absences year to date.
User Interface
Dashboard Example
Figure 1 shows the Days Absent metric as seen on the campus dashboard.

Figure 1 TSDS Days Absent Metric
Status Definition
The Status Indicator is determined by campus-specific thresholds (campus goals) which are set at the district level. The TSDS default attendance threshold is 10%.
Table 2 lists the status indicators and trend comparisons as seen on the campus dashboard.
Metric Indicator | Trend Comparisons | ||||
Metric Name | Sub-metric Name | Metric Status Indicator | Compares: | To: | |
Days Absent | Days Absent | Green (Percentage) = if percentage of students with 8 or more days absent is less than or equal to campus goal Red (Percentage) = if percentage of students with 8 or more days absent is greater than the campus goal | Percent of students with more than 8 days absent | Campus Goal | |
| Unexcused Days Absent | Green (Percentage) = if percentage of students with 8 or more unexcused days absent is less than or equal to campus goal Red (Percentage) = if percentage of students with 8 or more unexcused days absent is greater than the campus goal | Percent of students with more than 8 unexcused days absent | Campus Goal | ||
(a) The Value column displays the percent of students who have been absent more than 8 days in the current school year.
Trend Definition
Table 3 lists the trend indicators for the Days Absent metric.
Table 3 Trend Indicators for TSDS Days Absent Metric | ||
Trend Indicators: Objective is to indicate Days Absent | ||
| Up red | If the value for the current time frame is more than 5% higher than the prior time frame. |
| Unchanged | If the value for the current time frame is less than or equal to 5% higher or less than or equal to 5% points lower. |
| Down green | If the value for the current time frame is more than 5% lower than the prior time frame. |
The trend does not display for the first occurrence of a time frame since data is not available.
Periodicity
Best practice is to load the data for this metric daily.
Recommended Load Characteristics | |
Calendar | Throughout the school year |
Frequency of data load | Daily, Weekly, Monthly |
Latency | 4 weeks |
Interchange schema | Interchange-StudentAttendance.xsd |
Tooltips
The standard tooltips for the metric definition, column headers, and help functions display for this metric.
The following are tooltips specific to the Days Absent metric:
- Green metric status: OK
- Red metric status: HIGH
- 'More' indicates drill down views for this metric
 is ‘Trend is unchanged from prior time frame'
 is ‘Trend is going down from prior time frame'
 is ‘Trend is going up from prior time frame'
Business Rules
The Days Absent campus-level metric shows the percent of students on the campus with 8 or more days absent year-to-date. It includes two granular metrics: Days Absent and Unexcused Days Absent. The Days Absent metric shows students with 8 or more days absent, including excused and unexcused absences. The Unexcused Days Absent metric only reflects the percent of students who have 8 days of unexcused absences year-to-date.
- Attendance should be calculated at the student level
Calculation
The number of days absent is a simple calculation of the percentage of students who have 8 or total absences (excused and unexcused) year to date over the number of students with attendance data for the campus. The default goal is 10%.
The number of unexcused days absent is a simple calculation of the percentage of students who have 8 or more unexcused absences year to date over the number of students with attendance data for the campus. The default goal is 10%.
Calculated Values |
Days absent = number of students with eight or more absences year to date/the total number of students with attendance data for the campus |
Unexcused Days Absent = number of students with eight or more unexcused absences year-to-date / the total number of students with attendance data for the campus |
Data Anomalies
Data Anomalies
Currently there is no way to account for students who withdraw and re-enroll. The attendance metrics account for attendance from the most recent enrollment date. Detail views will show a more complete history.
The denominator for attendance metrics is not dynamic. If a student enters school later than the first day, he is considered present for the entire time he missed.
Early education and Pre-kindergarten students that have attendance data will be included in the days absent campus rollup; the denominator of included students may be larger than average daily attendance on campuses with these students.
The days absent drilldown will only show the breakdown of days absent for grading periods that have ended. Thus the year to date number may be slightly higher than the total of the absences in the grading periods if the student has been absent in the current grading period. The year to date number will be the most current number and is updated with nightly loads.
Footnotes
Footnotes are used to provide addition data information concerning the metric. Footnotes are sequential for the entire page. Therefore, a metric's footnote may not begin with the number 1.
The following footnotes appear below the metric:
Best practice is to footnote students transferring in that have not been present for a full time frame.
Metrics are sensitive to when and how often the data is loaded.
Late enrollees are likely to be missing tardy data.
Date of Refresh
Best practice is for the date of last data refresh to appear next the metric in the following format:
(Through April 22, 2010)
Implementation Considerations
Designation of Campus Rule for Daily Attendance
Campuses typically designate a specific class (e.g., homeroom), or a time or class period on which to base daily attendance. The studentGPS® Dashboards use student attendance in this designated class period to calculate this attendance metric. If this period is not designated, the metrics will not appear.
Late Enrollment
The Dashboards do not currently adjust attendance rate metrics for late enrollment students. Attendance metrics may appear artificially low for these students.
Classification of Days as Non-Instructional Days
The number of instructional days in a designated period is derived from the campus calendar.
Frequency of Uploading Data
The metric computation implementation may vary depending on the periodicity of loading the data. For example, a daily refresh requires that you load data for only a single day (i.e., the last instructional day). Less frequent uploads require that you load data for each day since the date of the last load.
Length of Time Frames
The decision to show attendance metric values for specific time frames (e.g., Last Four Weeks) was based on educator input. However, these time frames are currently set at the system level and not configurable by a district.
Campus Goals
Metric goals at the campus level are set by district personnel with claim sets that provide access to the Goal Setting tab. District personnel should set campus goals in cooperation with campus administration with consideration of stated campus goals.
Types of Absences
This metric requires that the district's Student Information System (SIS) store a the type of student absence and a description of the reason for the absence. The type of absences, also known as Attendance Event Descriptor, captured in the SIS consists of tardy, excused or unexcused absences.
This metric uses excused and unexcused absences. The reason for excused absences is displayed (see Drill Down section). Tardy occurrences are measured as a separate metric.
Drill Downs
Drill Down Views
The dashboards include the option to drill down and see more detail that is associated with a metric. Table 7 lists the drill down views that are recommended for this metric.
| Grade Level | Graph of percent of students meeting the student threshold for the metric by grade level | |
| Historical | Graph of metric values across multiple time periods | |
| Student List | List of students who do not meet the student level threshold for the metric for the "specified timeframe" |
Dashboard Example
Figure 2 shows TSDS Grade Level Chart for Days Absent.

Figure 2 TSDS Days Absent Grade Level Chart
Dashboard Example
Figure 3 shows TSDS historical graph for Days Absent.
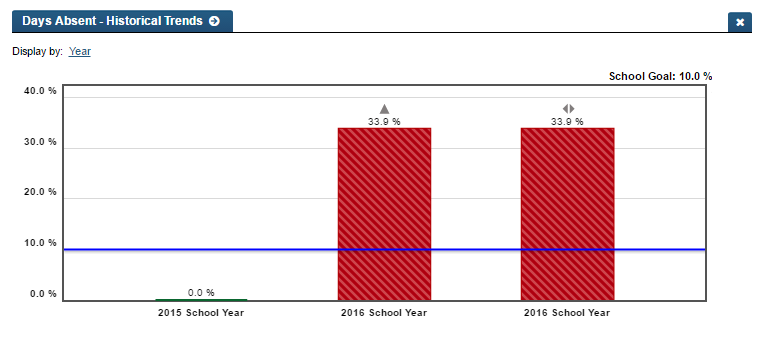
Figure 3 TSDS Days Absent Historical Chart
Business Rules
The Historical Graph allows the user to see historical data across multiple timeframes. As time passes, there are many bars to be displayed; therefore, the slider on the bottom allows the user to adjust the number of bars displayed as well as the time period shown. The timeframes for this metric were chosen based on educator feedback.
Drill down Tooltips
Grade Level Chart:
- The number of students who met the student goal out of the total number of students enrolled on the campus will display as you hover over the bars of the graph.
- Green bar = met the campus goal
- Red bar = did not meet the campus goal
Historical Chart:
- The start and end dates and the percent value of the metric for that time period are shown as you hover over a bar of the graph.
- The slider bar adjusts the number of time periods viewed in the graph.
- Green bar = student did meet the student goal
- Red bar = student did not meet the student goal