Dashboard Metrics


Benchmark Performance
Background
Campus Dashboard Metrics
Benchmark assessments are assessments administered periodically throughout the school year, at specified times during a curriculum sequence, to evaluate students’ knowledge and skills relative to an explicit set of longer-term learning goals. The design and choice of benchmark assessments is driven by the purpose, intended users, and uses of the instruments. Benchmark assessment can inform policy, instructional planning, and decision-making at the classroom, school and/or district levels.
Primary Metric
- Benchmark Performance: the percentage of students meeting a given threshold on a benchmark assessment.
User Interface
Dashboard Example
Figure 1 shows the Student Benchmark Assessment metric as seen on the campus dashboard.
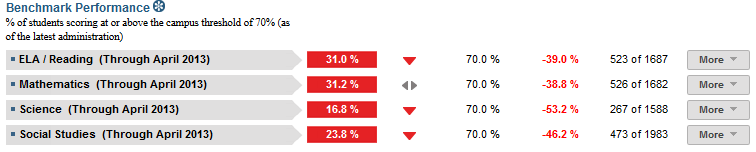
Figure 1 TSDS Benchmark Performance Metric
Status Definition
The Status Indicator is determined by campus-specific thresholds (campus goals) which are set at the district level. The TSDS default threshold for each core subject is 70%.
Metric Indicator | Trend Comparisons | |||
Metric Name | Sub-metric Name | Metric Status Indicator | Compares: | To: |
Benchmark Performance | ELA/Reading | Red (Below) = if rolled up total grade level student assessment score percentage is less than campus goal Green (Above) = if student assessment score percentage is greater than or equal to campus goal | Current assessment score | Previous Assessment score |
Mathematics | Red (Below) = if student assessment score percentage is less than campus goal Green (Above) = if student assessment score percentage is greater than or equal to campus goal | Current assessment score | Previous assessment score | |
| Science | Red (Below) = if student assessment score percentage is less than campus goal Green (Above) = if student assessment score percentage is greater than or equal to campus goal | Current grading period | Previous grading period | |
Social Studies | Red (Below) = if student assessment score percentage is less than campus goal Green (Above) = if student assessment score percentage is greater than or equal to campus goal | Current assessment score | Previous assessment score | |
(a) The Value column displays the percentage of TEKS the student mastered out of the total number tested.
(b) The trends do not display if prior-year benchmark assessment data does not exist.
Trend Definition
Table 3 lists the trend indicators for the Benchmark Assessment Mastery metric.
The trend does not display if the student has not taken a previous benchmark assessment.
Trend Indicators: Objective is to indicate Benchmark Assessment Mastery | |||
| Up green | If the value for the current period is more than 5 percentage points higher than the prior period | |
| Unchanged | If the value for the current period is less than or equal to 5 percentage points higher or less than or equal to 5 percentage points lower than the prior time frame | |
| Down red | If the value for the current period is more than 5 percentage points lower than the prior period | |
Delta Definition
Delta Indicators: Objective is to indicate Benchmark Performance | |||
Metric Name | Sub-Metric Name | Campus Goal | Delta |
Benchmark Performance | ELA/Reading | Set Campus Goal | Red (Percentage) = if the calculated delta is less than the campus goal Black (Percentage) = if the calculated delta is equal to or greater than the campus goal |
| Mathematics | Set Campus Goal | Red (Percentage) = if the calculated delta is less than the campus goal Black (Percentage) = if the calculated delta is equal to or greater than the campus goal | |
| Science | Set Campus Goal | Red (Percentage) = if the calculated delta is less than the campus goal Black (Percentage) = if the calculated delta is equal to or greater than the campus goal | |
| Social Studies | Set Campus goal | Red (Percentage) = if the calculated delta is less than the campus goal Black (Percentage) = if the calculated delta is equal to or greater than the campus goal | |
Periodicity
Recommended Load Characteristics | |
Calendar | Throughout the school year |
Frequency of data load | Beginning and end of year |
Latency | 4 weeks |
Interchange schema | Interchange-StudentAssessment.xsd |
Tooltip
The standard tooltips for the metric definition, column headers, and help functions display for this metric.
The following tooltips are specific to the Benchmark Performance metric:
- Green metric status: OK
- Red metric status: LOW
- 'More' indicates drill down views for the metric
 is ‘No change from the prior period'
 is ‘Getting worse from the prior period’
 is 'Getting better from the prior period'
Business Rules
All assessment data is displayed by the specific subject area:
- Elementary subjects: reading, writing, mathematics, science and social studies
- Middle school subjects: reading, writing, mathematics, science and social studies plus high school subjects that are tested at middle level (e.g., Algebra I, English I)
- High School subjects: Algebra I, Geometry
Data Source Requirements
- Benchmark assessments are loaded into the dashboards periodically as they are administered throughout the year.
- Transfer students (late enrollment) who do not have complete transcripts should be indicated.
- State criteria differs by state and by year. Developers have the option to adjust the thresholds to fit specific organizational criteria.
Calculated Values
Table 5 defines how values for each subject are calculated. The result of the calculation displays in the Value column.
| Metric | Calculation |
Benchmark Performance | Percentage of students scoring 70% or better on the most recent benchmark administration in that subject area |
Data Anomalies
Anomalies
- Benchmark assessment administration is defined by at the campus and/or district level. Districts/campuses may not test all students in all subjects.
- Some subjects may be assessed more frequently than others, resulting in different dates of refresh for each subject.
- Benchmark assessment questions must be tied to specific TEKS identified in the assessment metadata in order to show objective-level performance/TEKS Mastery.
- The scores for test administrations that are not tied to specific TEKS objectives will show in the benchmark mastery metric, but will not show in the objective mastery metric.
- Late enrollees may have taken Benchmark Assessment tests at their previous school
- Benchmark metrics include data from a number of a different administration dates
Footnotes
An icon appears next to any metric where students have been excluded. When the user hovers over the icon, count of students who have been excluded appear in a tooltip with the reason(s) for exclusion. By clicking on the icon, the data administrator will link to the data administrator’s page for more detail.
Best practice is to exclude and footnote students based on the following criteria:
- Missing data
Date of Refresh
Best practice is for the date of last data refresh to appear next the metric in the following format:
- (Through April 2010) –container level
(05/10) – granular level
Implementation Considerations
Reporting Different Versions of Benchmark Assessments
Students may, in any single grade, take different versions of a benchmark test for different subjects. Teachers may distinguish the information based on assessment title and administration date.
Drill Downs
The dashboards include the option to see more detail that is associated with a specific metric. Table 7 lists the drill down views that are recommended for this metric.
| Grade Level | Graph of percent of students meeting the student threshold for the metric by grade level | |
| Student List | List of students who do not meet the threshold for this metric for the specified period. | |
| Historical | Graph of metric values across days, weeks, grading periods, semesters, and years |
User Interface
Dashboard Example
Figure 2 shows the Grade Level Chart for the Benchmark Performance metric as seen on the campus dashboards.
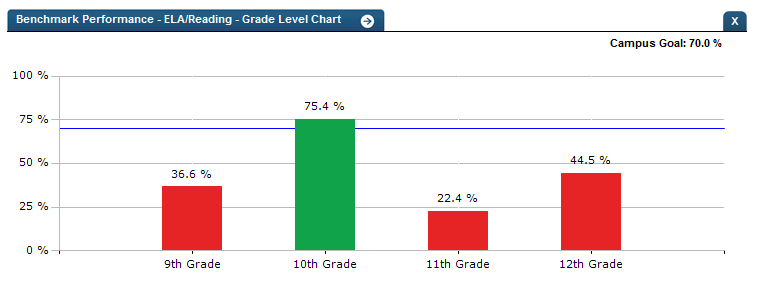
Figure 2 TSDS Benchmark PerformanceGrade Level Chart
Figure 3 shows the Historical chart for the Benchmark Performance metric as seen on the campus dashboards.
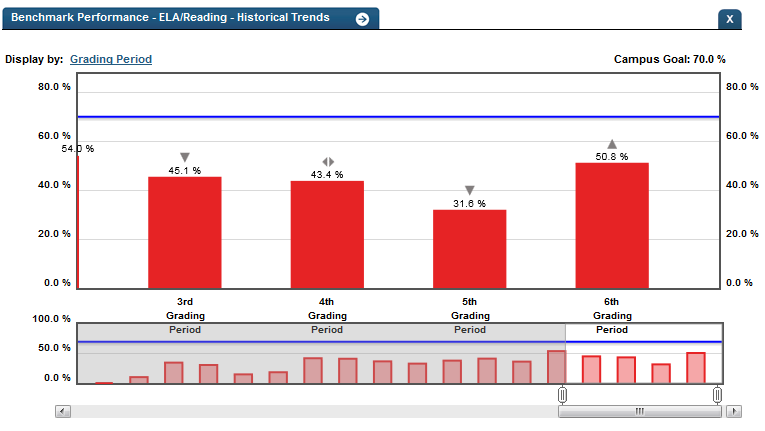
Figure 3 TSDS Benchmark Performance Historical Chart
Business Rules
The Historical Graph allows the user to see historical data across multiple timeframes. As time passes, there are many bars to be displayed; therefore, the slider on the bottom allows the user to adjust the number of bars displayed as well as the time period shown. The timeframes for this metric were chosen based on educator feedback.
Drill down Tooltips
Grade Level Chart:
- The number of students who met the student goal out of the total number of students enrolled on the campus will display as you hover over the bars of the graph.
- Green bar = met the campus goal
- Red bar = did not meet the campus goal
Historical Chart:
- The start and end dates and the percent value of the metric for that time period are shown as you hover over a bar of the graph.
- The slider bar adjusts the number of time periods viewed in the graph.
- Green bar = student did meet the student goal
- Red bar = student did not meet the student goal