Dashboard Metrics


Grades Below C Level
Background
Campus Dashboard Metrics
Because of the need to closely monitor course performance, many school districts across the nation, including Chicago, Dallas and New York, have incorporated metrics on course performance and associated credit accumulation into their internal performance management dashboards. During focus groups conducted with over 2,600 educators throughout Texas, the Grades Below C Level metric, as presented in screen shots of the campus dashboard, was considered useful by 89 percent of those surveyed. By comparison, the Grades Below C Level metric when reported at the student level was considered useful by 92% of respondents.
Primary Metric
- Class Grades Below C Level: percent of students with one, two and three or more course grades below C for the most recent grading period.
User Interface
Dashboard Example
Figure 1 shows the Grades Below C Level metric as seen on the campus dashboard.
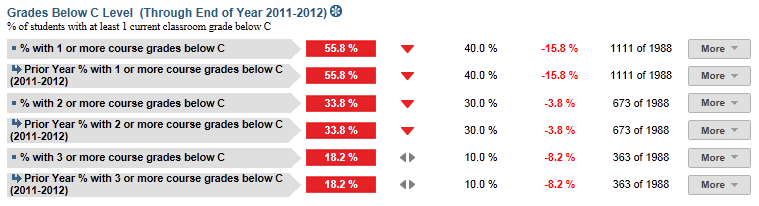
Figure 1 TSDS Grades Below C Level Metric
Status Definition
The Status metric identifies the percentage of students with a specified number of grades below C (numeric grades less than 75 and letter grades as D or F) in the last reported grading period, as follows:
The Status indicator is determined by campus-specific thresholds (campus goals) which are set at the district level. The threshold value is configurable and default values for each specified number of courses are
- 1 course grade below C = 40%
- 2 course grades below C = 30%
- 3 or more course grades below C = 10%
Table 2 defines the Status indicators. The calculated percentage is displayed with the indicator.
Metric Status Indicator | Comparisons | |||
Metric Name | Sub-metric Name | Metric Status Indicator | Trend | Campus Goal (Delta) |
Grades Below C | % with 1 course grade below C | Red (Percentage) = if percentage of students with 1 course grade below C is greater than or equal to campus goal Green (Percentage) = if percentage of students with 1 course grade below C is less than campus goal | After second grading period, compare to prior crading period | Campus goal and the calculated percentage of students with 1 course grade below C |
% with 2 course grades below C | Red (Percentage) = if percentage of students with 2 course grades below C is greater than or equal to campus goal Green (Percentage) = if percentage of students with 2 course grades below C is less than campus goal | After second grading period, compare to prior crading period | Campus goal and the calculated percentage of students with 2 course grades below C | |
% with 3 course grades below C | Red (Percentage) = if percentage of students with 3 course grades below C is greater than or equal to campus goal Green (Percentage) = if percentage of students with 3 course grades below C is less than campus goal | After second grading period, compare to prior crading period | Campus goal and the calculated percentage of students with 3 or more course grades below C | |
(a) The Value column displays the number of students with the specified number of grades below C out of the total number of students.
Trend Definition
Trend Indicators: Objective is to indicate Course Grades Below C Level | |||
| Up green | If the value for the current time frame is more than 5 percentage points higher than the prior time frame, then display a gray arrow trending upward. | |
| Unchanged | If the value for the current time frame is less than or equal to 5 percentage points higher or less than or equal to 5 percentage points lower than the prior time frame, then display two gray arrows pointing outward indicating no direction. | |
| Down red | If the value for the current time frame is more than 5 percentage points lower than the prior time frame, then display a gray arrow trending downward. | |
The trend does not show for the first occurrence of a time frame since data is not available.
Delta Definition
The Delta column reflects the absolute value of the difference between the campus percentage (Status column) and the campus goal percentage (Campus Goal column).
Delta Indicators: Objective is to indicate Repeated Courses | |||
Metric Name | Sub-Metric Name | Campus Goal | Delta |
Grades Below C | % with 1 course grade below C | Set campus goal | Red (Delta Percentage) = if the student grades below C percentage is more than the campus goal Black (Delta Percentage) = if the students grades below C percentage is less than the campus goal |
% with 2 course grades below C | Set campus goal | Red (Delta Percentage) = if the students grades below C percentage is more than the campus goal Black (Delta Percentage) = if the students grades below C percentage is less than the campus goal | |
% with 3 course grades below C | Set campus goal | Red (Delta Percentage) = if the students grades below C percentage is more than the campus goal Black( Delta Percentage) = if the students grades below C percentage is less than the campus goal | |
Periodicity
The data is most actionable when loaded at the end of each grading period after grades are posted. Grading periods vary by state and district. In Texas, grading periods are typically six or nine weeks.
Recommended Load Characteristics | |
Calendar | Throughout the school year |
| Frequency of data load | Once each grading period |
Latency | 6-9 weeks |
Interchange schema | Interchange-StudentGrade.xsd |
Tooltips
The standard tool tips for the metric definition, column headers, and help functions display for this metric.
- Green metrics status: OK
- Red metric status: HIGH
- 'More' indicates drill down views for this metric
 is ‘No change from the prior period'
 is ‘Getting worse from the prior period’
 is 'Getting better from the prior period'
Business Rules
The Grades Below C Level metric identifies the percentage of students performing below a C for one, two, or three or more courses, for the most recent grading period in the current academic year:
- For letter grades, below C is defined as a D or F
- For numeric grades, below C is defined as below a configurable threshold (default < 75)
The metric must have at least one completed grading period of information; the metric is blank until the first grading period is completed and grades are recorded.
The length of the grading period is configurable and is defined by the district—typically either 6 or 9 weeks. The final grades are used once they are entered into the system.
Data Assumptions
- Course grades are numeric or letter-based.
- District has set the value that drives the campus goals.
Computed Values
The cohort is the set of current students for whom grades have been loaded for the last reported grading period. The cohort includes students of all grades at the campus and it excludes transfer students (late enrollment) for whom a grade is not available for the last reported grading period.
The metric value is the percentage of students that have a specified number of course grades below C for the last grading period.
Table 6 defines how values on the campus dashboard are calculated. The result of the calculation displays in the Status column on the dashboard.
Metric | Calculation |
Percent with 1 course grade below C | Number of students in cohort with one course grade below C for the latest reported grading period * 100 / Total students in cohort |
Percent with 2 course grades below C | Number of students in cohort with two course grades below C for the latest reported grading period * 100 / Total students in cohort |
Percent with 3 or more course grades below C | Number of students in cohort with three or more course grades below C for the latest reported grading period * 100 / Total students in cohort |
Data Anomalies
Anomalies
Best practices is to use footnotes to address these anomalies:
- Loading of data from each grading period
- Late enrollees may not have previous grading period grades from another school
- Missing transcripts for transfer students
- In the 1.5 release districts were given the ability to set the threshold for "below C" manually in the system administrator dashboard settings. Changes will appear after the next successful build.
- Though Grades Below C is a secondary metric, the district view is currently including elementary schools. The data appearance depends on how a district's elementary schools report grades.
- If a student does not yet have a first grading period grade, trend for this metric is based on the prior year final grade.
- Prior year metric values are based on the total of final grades below C. Prior year trends are based on the last grading period metric value vs. final grading period values.
Footnotes
Footnotes are used to provide addition data information concerning the metric. Footnotes are sequential for the entire page. Therefore, a metric's footnote may not begin with the number 1.
The following footnotes appear below the metric:
- Best practice is to footnote students that are not present for a full grading period.
Date of Refresh
Best practice is for the date of last data refresh to appear next the metric in the following format:
(Through Second Six Weeks)
Implementation Considerations
Late Enrollments or Missing Transcript Information
Students who transferred or enrolled late or students with incomplete data in their course transcript from the previous grading period are not included in the cohort.
Numeric or Letter Grading System
Best practice is for the metric to support both numeric and letter grading systems.
Campus Goals
Best practice is to set the goals for each campus at the district level. A secure mechanism is required to allow the district to set and maintain those goals.
Drill Downs
Drill Down Views
The dashboards include the option to see more detail that is associated with a metric. Table 7 lists the drill down views that are recommended for this metric.
Grade Level Chart | Graph by grade level of students who met the goal. | |
Student List | List of students who do not meet the threshold for this metric for the specified period. | |
| Historical Chart | Graph of metric values across multiple time frames. |
User Interface
Dashboard Example
Figure 2 shows the grade level chart for the Grades Below C metric as seen on the campus dashboards.
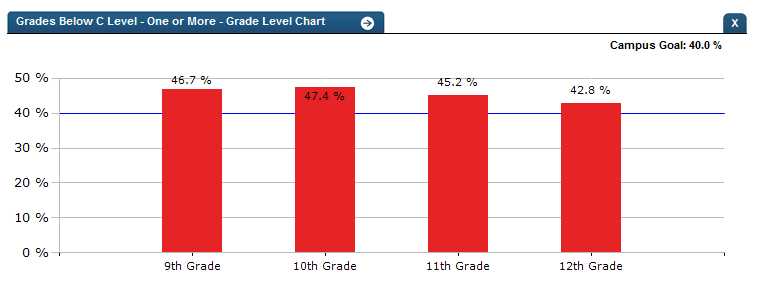
Figure 2 TSDS Grades Below C Grade Level Chart
Figure 3 shows the historical chart for the Grades Below C metric as seen on the campus dashboards.
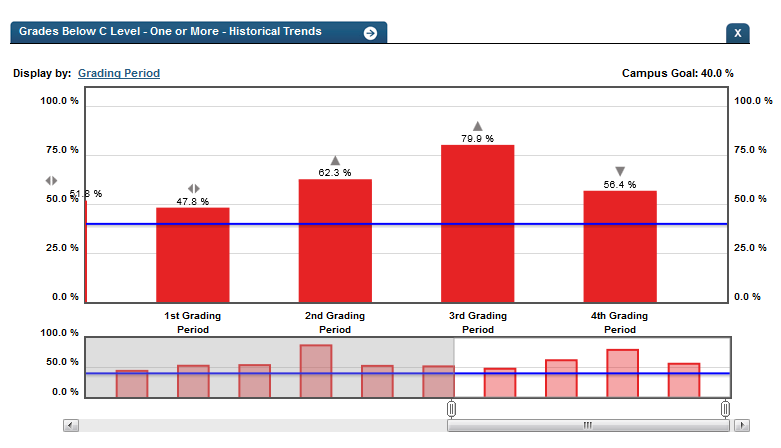
Figure 3 TSDS Grade Below C Historical Chart
Business Rules
The Historical Graph allows the user to see historical data across multiple timeframes. As time passes, there are many bars to be displayed; therefore, the slider on the bottom allows the user to adjust the number of bars displayed as well as the time period shown. The timeframes for this metric were chosen based on educator feedback.
Drill down Tooltips
Grade Level Chart:
- The number of students who met the student goal out of the total number of students enrolled on the campus will display as you hover over the bars of the graph.
- Green bar = met the campus goal
- Red bar = did not meet the campus goal
Historical Chart:
- The start and end dates and the percent value of the metric for that time period are shown as you hover over a bar of the graph.
- The slider bar adjusts the number of time periods viewed in the graph.
- Green bar = student did meet the student goal
- Red bar = student did not meet the student goal