Dashboard Metrics


Credit Accumulation
Background
Campus Dashboard Metrics
In order to monitor progress toward completion of graduation requirements, many school districts across the nation, including Chicago, Dallas and New York, have incorporated metrics on credit accumulation into their internal performance management dashboards. During focus groups conducted with over 2,600 educators throughout Texas, the Credit Accumulation metric, as presented in screen shots of the campus dashboard, was considered useful by 94% of those surveyed.
Primary Metric
- Credit Accumulation: percent of students in the 10th, 11th and 12th grades earning the required number of credits under the Texas Recommended or Foundation with Endorsements graduation plans (26 total credits before graduation) as of the end of the most recent grading period.
User Interface
Dashboard Example
Figure 1 shows the Credit Accumulation metric as seen on the campus dashboard. Please note that the figure below shows an earlier example. The caption has been updated to read, "% of students meeting required # of credits for Recommended or Foundation with Endorsements Graduation Plan (26 credits) as of the end of the prior school year."
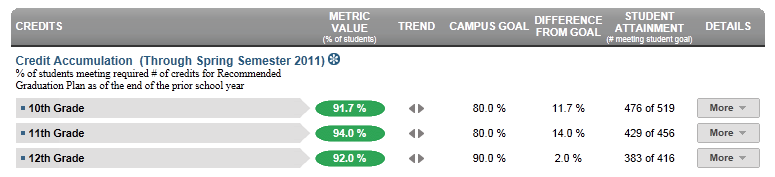
Figure 1 TSDS Credit Accumulation
Status Definition
The Status column is the percentage of students meeting the required number of credits for graduation at each grade level starting with 10th grade. The number of credits required for graduation are set by the state. For example, in Texas, the Recommended graduation plan requires 26 credits. The default mechanism to track credits by grade uses a linear path for the four years of high school (grades 9-12) which assumes accumulating 6.5 credit hours each year. The credit thresholds to graduate and for each year can be adjusted to a specific district's or state's criteria.
The Status indicator is determined by campus-specific thresholds (campus goals) which are set at the district level. The TSDS default thresholds are 80%, 80%, and 90%.
Table 2 defines the Status indicators. The actual percentage is displayed with the indicator.
Metric Status Indicator | Comparisons | |||
Metric Name | Sub-metric Name | Metric Status Indicator | Trend | Campus Goal (Delta) |
Credit Accumulation | 10th Grade | Red (Percentage) = if percentage of students meeting the required number of credits is less than campus goal Green (Percentage) = if percentage of students meeting the required number of credits is greater than or equal to the campus goal | Current year to prior year | Campus Goal and the calculated percentage of students meeting the required number of credits |
11th Grade | Red (Percentage) = if percentage of students meeting the required number of credits is less than the campus goal Green (Percentage) = if percentage of students meeting the required number of credits is greater than or equal to the campus goal | Current year to prior year | Campus Goal and the calculated percentage of students meeting the required number of credits | |
12th Grade | Red (Percentage) = if percentage of students meeting the required number of credits is less than the campus goal Green (Percentage) = if percentage of students meeting the required number of credits is greater than or equal to campus goal | Current year to prior year | Campus Goal and the calculated percentage of students meeting the required number of credits | |
(a) The Value column displays the total number of students meeting the required number of credits out of the total number of students in each grade level's cohort.
Trend Definition
Table 3 lists the trend indicators for the Credit Accumulation metric.
Trend Indicators: Objective is to indicate Credit Accumulation | |||
| Up green | If the value for the current time frame is more than 5 percentage points higher than the prior time frame, then display a gray arrow trending upward. | |
| Unchanged | If the value for the current time frame is less than or equal to 5 percentage points higher or less than or equal to 5 percentage points lower than the prior time frame, then display two gray arrows pointing outward indicating no direction. | |
| Down red | If the value for the current time frame is more than 5 percentage points lower than the prior time frame, then display a gray arrow trending downward. | |
The trend does not show for the first occurrence of a time frame since data is not available.
Delta Definition
The Delta column is the absolute value of the difference between the campus percentage (Status column) and the campus goal percentage (Campus Goal column).
Delta Indicators: Objective is to indicate Credit Accumulation | |||
| Metric Name | Sub-metric Name | Campus Goal | Delta |
Credit Accumulation | 10th Grade | Set campus goal | Red (Delta Percentage) = if the percentage of students meeting the required number of credits is less than the campus goal Black (Delta Percentage) = if the percentage of students meeting the required number of credits is greater than the campus goal |
11th Grade | Set campus goal | Red (Delta Percentage) = if the percentage of students meeting the required number of credits is less than the campus goal Black (Delta Percentage) = if the percentage of students meeting the required number of credits is greater than the campus goal | |
12th Grade | Set campus goal | Red (Delta Percentage) = if the percentage of students meeting the required number of credits is less than the campus goal Black (Delta Percentage) = if the percentage of students meeting the required number of credits is greater than the campus goal | |
Periodicity
Best practice is to load this data as soon as a semester grading period has ended and transcript information is updated. At minimum, load this information prior to the beginning of a school year to assess any scheduling and/or targeted intervention required. Other events may necessitate loading the data, such as when state credit requirements change and/or when large numbers of students transfer in or out of a campus.
Recommended Load Characteristic s | |
Calendar | Throughout the school year |
Frequency of data load | End of each grading period |
Latency | Grading period |
Interchange schema | Interchange-StudentGrade.xsd |
Tooltips
The standard tool tips for the metric definition, column headers, and help functions display for this metric.
- Green metric status: OK
- Red metric status: LOW
- 'More' indicates drill down views for this metric
 is ‘No change from the prior period'
 is ‘Getting worse from the prior period’
 is 'Getting better from the prior period'
Business Rules
The Credit Accumulation metric indicates the percentage of students at or above a linear path for meeting the number of credits for graduation.
- At the start of the school year, a student is "on track" if their total number of credits is at or above the targeted number of credits for the year. Table 6 lists the targeted number of credits for each year by grade level.
Student’s | Yearly Recommended Credits | Percent of Target |
|---|---|---|
9 | not applicable | not applicable |
10 | 6.5 | 25% |
11 | 13 | 50% |
12 | 19.5 | 75% |
- After mid-year first-semester grade data is loaded, a student is "on track" if their total number of credits is at or above the targeted number of credits for mid-year. Table 7 lists the targeted number of credits for mid-year by grade level.
Student’s | Mid-Year Recommended Credits | Percent of Target |
|---|---|---|
9 | not applicable | not applicable |
10 | 9.5 | 37% |
11 | 16 | 62% |
12 | 22.5 | 87% |
On a straight linear basis the mid-year semester student needs to earn 3.25 credits. Because a student can only earn credits in 0.5 increments, the target is rounded down to 3 credits.
For students who fail a class, the credit is not earned or counted. If the student repeats the class and passes, the credit is earned and counted.
If a student is missing a transcript or has a partial transcript, that student is not included in the cohort.
If the Middle School campuses send the transcripts for High School credits earned, these credits are considered in this metric.
Data Assumptions
- This metric is not available for students currently in the 9th grade.
- The student’s transcript must reflect the current credits earned.
- The credit targets are set based upon the State’s graduation requirements.
- The metric tracks to a linear accumulation of credits.
- Any course that is included in a student transcript is included in the calculation for credits earned.
Computed Values
The number of accumulated credits is taken directly from the student's academic records.
Table 8 defines how values on the campus dashboard are calculated for each cohort grade level. The result of the calculation displays in the Status column on the dashboard.
Metric | Calculation |
For each grade level | (Number of current students in cohort where credit accumulation is equal to or greater than target credits) * 100 / (Total number of current students in cohort) |
Calculation Notes
The cohorts are the students currently in 10th, 11th, and 12th grades, respectively. Transfer (late enrollment) students with an incomplete transcript that does not reflect an accurate number of accumulated credits are excluded from the cohort. A transcript is incomplete if it is missing a year’s worth of data in the student transcript.
The yearly targets for accumulated credits are:
- 10th grade: 25% of the credits to graduate (26 credits)
- 11th grade: 50% of the credits to graduate
- 12th grade: 75% of the credits to graduate
The semester targets for accumulated credits are:
- 10th grade: 37% of the credits to graduate (26 credits)
- 11th grade: 62% of the credits to graduate
- 12th grade: 87% of the credits to graduate
Data Anomalies
Footnotes
An icon appears next to any metric where students have been excluded. When the user hovers over the icon, count of students who have been excluded appear in a tooltip with the reason(s) for exclusion. By clicking on the icon, the data administrator will link to the data administrator’s page for more detail.
Best practice is to exclude and footnote students based on the following criteria:
- Missing data
Date of Refresh
Best practice is for the date of last data refresh to appear next the metric in the following format:
- (Through Spring Semester 2017)
Implementation Considerations
Incomplete Transcript
Students who transferred in may have an incomplete transcript pending when their student record is received by their current campus. Best practice is to exclude students from the cohort whose cumulative credits cannot be accurately obtained. This metric under represents students who are in the process of earning recovery credits or credits by exam – e.g., students transferring from alternative campuses or detention facilities, students who were previously home schooled. To aid administrators in identifying these students, a future enhancement to the TSDS dashboards will add the ability to provide a count and listing of students who do not have complete transcripts
Targets for Accumulated Credits
The targets for accumulated credits are based upon state-defined credit requirements for graduation. A future enhancement under consideration for this metric is to track not only cumulative credits, but also the composition of credits against a set of state-specific requirements and/or a student’s chosen graduation plan.
Inclusion of Credits
TSDS assumes that any credit type included in a transcript (e.g., standard, recovery, credits by exam, on-line) is to be included in the metric calculation. If any exceptions are relevant, these need to be accounted for in the metric calculation and assumptions.
Campus Goals
Best practice to set campus goals at the district level. A secure mechanism is required to allow the district to set and maintain those goals.
Drill Downs
Drill Down Views
The dashboards include the option to drill down and see more detail that is associated with a metric. Table 9 lists the drill down views that are recommended for this metric.
| Historical | Graph of metric values across semesters and years. | |
| Student List | List of students who do not meet the threshold for this metric for the specified period. |
User Interface
Dashbaord Examples
Figure 2 shows the Historical Credit Accumulation as seen in the campus dashboards.
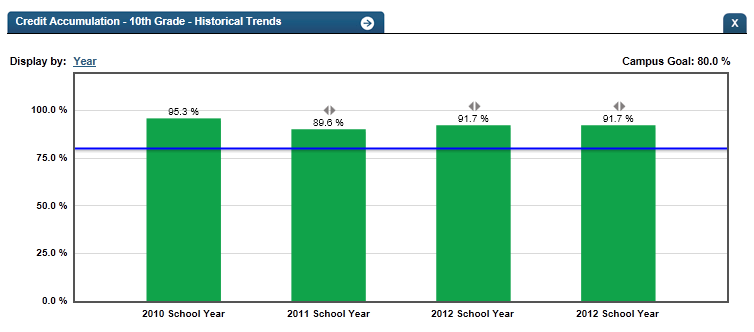
Figure 2 TSDS Historical Credit Accumulation