Dashboard Metrics


Advanced Course Potential
Background
Campus Dashboard Metrics
Because of the importance of rigorous coursework to postsecondary success and to support district efforts to increase advanced course completion, several districts, including Charlotte and Dallas, are beginning to incorporate into their internal performance management dashboards metrics to monitor advanced course enrollment among eligible students. In focus group discussions conducted with over 2,600 educators throughout Texas, the Advanced Course Potential metric was considered useful by 92% of respondents when reported at the campus level, but by only 85% of respondents when reported at the student level. The implication is that this metric, though still valuable to teachers in targeting their individual students for advanced coursework, may be even more useful to campus leaders and counselors in developing strategic, school-wide approaches to increasing enrollment and success in advanced courses.
Primary Metric
- Advanced Course Potential - Current Year: for the current year only, whether or not a student has demonstrated potential for advanced coursework based on state assessments (the student's STAAR EOC is Level III) and whether or not they are enrolled in advanced courses (AP, IB or DE courses) in the four core subject areas.
User Interface
Dashboard Example
Figure 1 shows the Advanced Course Potential student list as seen on the campus dashboard.
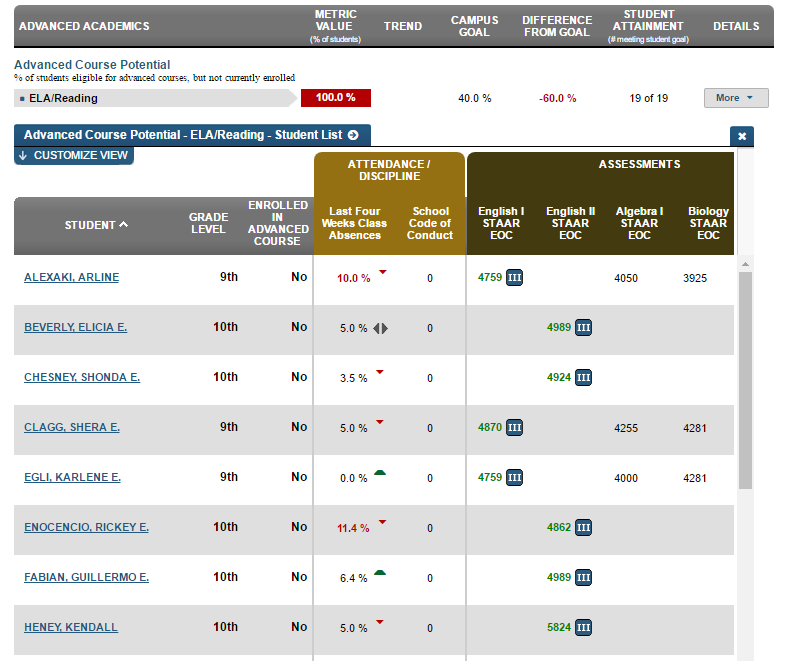
Figure 1 TSDS Advanced Course Potential Student List
Figure 2 shows the Advanced Course Potential metric as seen on the campus dashboard.
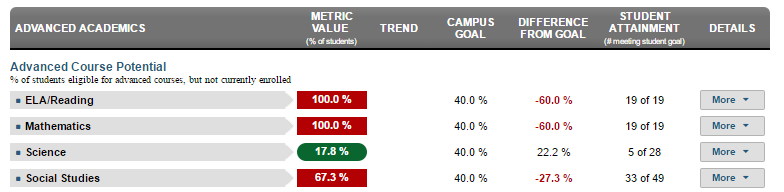
Figure 2 TSDS Advanced Course Potential Metric
Status Definition
The Status column is the percentage of students that demonstrate advanced course potential that are not currently enrolled in an advanced course. Advanced courses include AP courses, IB courses, other advanced courses identified locally in the course characteristic, and dual enrollment (also known as dual credit courses).
"Demonstrated advanced course potential" is based on a student's attainment of STAAR Level III. STAAR Level III is determined by whether a student meets the state-defined performance level that classify students as Level III. The results are determined by a specific STAAR flag indicating the student achieved an “Advanced” score (equivalent in concept to the TAKS commended score).
Table 2 defines the Status indicators. The actual percentage is displayed with the indicator.
Metric Status Indicator | Comparisons | |||
Metric Name | Sub-metric Name | Metric Status Indicator | Campus Goal | Difference from Goal |
Advanced Course Potential | ELA/Reading | Red (Percentage) = if percentage of students is greater than or equal to campus goal Green (Percentage) = if percentage of students is less than campus goal | Campus Goal | Difference between Campus goal and the calculated percentage of students |
Mathematics | Red (Percentage) = if percentage of students is greater than or equal to campus goal Green (Percentage) =if percentage of students is less than campus goal | Campus Goal | Difference between Campus goal and the calculated percentage of students | |
Science | Red (Percentage) = if percentage of students is greater than or equal to campus goal Green (Percentage) = if percentage of students is less than campus goal | Campus Goal | Difference between Campus goal and the calculated percentage of students | |
Social Studies | Red (Percentage) = if percentage of students is greater than or equal to campus goal Green (Percentage) = if percentage of students is less than campus goal | Campus Goal | Difference between Campus goal and the calculated percentage of students | |
(a) The Value column is the total number of students meeting the sub-metric criteria
out of the total number of students who demonstrate advanced course potential for each subject area.
Trends
Trend are not calculated for this metric.
Delta Definition
The Delta column is the absolute value of the difference between the campus-wide percentage (Status column) and the campus goal (Goal column).
Delta Indicators: Objective is to indicate Advanced Course Potential | |||
Metric Name | Sub-metric Name | Campus Goal | Delta |
Advanced Course Potential | ELA/Reading | Set campus goal | Red (D elta Percentage) = if the calculated percentage of students is greater than or equal to the campus goal Black (Delta Percent age) = if the calculated percentage of students is less than the campus goal |
Mathematics | Set campus goal | Red (Delta Percentage) = if the calculated percentage of students is greater than or equal to the campus goal Black (Delta Percentage) = if the calculated percentage of students is less than the campus goal | |
Science | Set campus goal | Red (Delta Percentage) = if the calculated percentage of students is greater than or equal to the campus goal Black (Delta Percentage) = if the calculated percentage of students is less than the campus goal | |
Social Studies | Set campus goal | Red (Delta Percentage) = if the calculated percentage of students is greater than or equal to the campus goal Black (Delta Percentage) = if the calculated percentage of students is less than the campus goal | |
Periodicity
Best practice is to load data for this metric as soon as new STAAR files are available.
Recommended Load Characteristics | |
Calendar | School year |
Frequency of data load | When new course enrollments occur |
Latency | 6-9 months |
Interchange schema | Interchange-StudentAssessment.xsd |
Tooltips
The standard tooltips for the metric definition, column headers, and help functions display for this metric.
- Green metric status: OK
- Red metric status: LOW
- 'More' indicates drill down views for this metric
Business Rules
The Advance Course Potential – Current Year metric is the percentage of students who in their prior year’s test show potential for advanced courses in specific subjects (as measured by Level III performance on the STAAR or STAAR EOC) but are not currently enrolled in advanced or pre-advanced (in middle school) courses in the following subjects in grade levels 6 – 12.
- English Language Arts (ELA)
- Mathematics
- Science
- Social Studies
A student is rated as having “advanced course potential” based upon their performance in standardized tests, specifically if the student’s performance on either the STAAR/STAAR EOC exceeds a certain threshold.
Data Assumptions
- Advanced courses are those defined by the course characteristic:
- AP courses
- PreAP courses(middle school)
- IB courses
- PreIB courses (middle school)
- Other advanced courses identified by the course characteristic
- The state-defined threshold of “Level III Advanced” is indicated in the STAAR results file.
- If the STAAR are taken multiple times, only the most recent results are used.
- Student STAAR scores by subject are available for the grade level (ELA/reading, mathematics, science, social studies and writing).
- The type of the STAAR test is available per student (e.g., STAAR-M, STAAR-Alt, etc.).
Computed Values
The cohort is the set of currently enrolled students that have Level III performance on STAAR or STAAR EOC.
Table 6 defines how values for each sub-metric are calculated. These percentages display in the Status column.
Metric Values | |
ELA/Reading | (Total of all current students whose STAAR/STAAR EOC for subject (any English test) is Level III and are not currently enrolled in an advanced course in ELA) * 100 / (Total of all students whose STAAR/STAAR EOC for subject (any English test) is Level III) |
Mathematics | (Total of all current students whose STAAR/STAAR EOC is Level III (any Math test) and are not currently enrolled in an advanced course in math) * 100 / (Total of all students whose STAAR/STAAR EOC for subject (any Math test) is Level III) |
Science | (Total of all current students whose STAAR/STAAR EOC is Level III (any science STAAR exam) and are not currently enrolled in an advanced course in science) * 100 / (STAAR/STAAR EOC is Level III (any science exam)) |
Social Studies | (Total of all current students whose STAAR/STAAR EOC is Level III (any social studies exam) and are not currently enrolled in an advanced course in social studies) * 100 / (Total of all current students whose STAAR/STAAR EOC is Level III (any social studies exam)) |
Data Anomalies
Date of Refresh
Best practice is for tooltip that reads, "See STAAR End of Course for date of refresh."
Anomalies
Best practice is to footnote these anomalies:
- Late enrollees may have taken college readiness tests at their previous school
- Loading of data from multiple administration dates
- Student may have missing transcript data
- Advanced Course Potential campus rollup displays students that have demonstrated potential for advanced courses but are not yet enrolled.
- The metric calculation for Advanced Course Potential is now based entirely on STAAR and STAAR End of Course performance in the state assessment category. When performance levels are set for STAAR 3-8, students who achieved a Level III in STAAR subject area tests will display "Yes" for advanced course potential. Until these performance levels are set and files are loaded, these students may be missing from the calculation.
- If an AP course is labeled as Gifted and Talented only, students in this course will not be counted as enrolled in an advanced course.
Implementation Considerations
Advanced Course Definition
Best practice is for developers to ensure that the definition of the exact courses that qualify as “advanced” include AP and IB courses as well as those defined as advanced by both the state and locally defined by the district. This mapping looks at the course characteristic type as coded locally. In the case of courses that are both AP and another type such as GT, the course should have the characteristic type of AP. If the other characteristic is recorded, the course will not appear as 'advanced.'
Campus Goals
Best practice is to set the goals for each campus at the district level. A secure mechanism is required to allow the district to set and maintain those goals.
Transfer Students (Late Enrollments)
Transfer students may not have complete transcripts from which to identify prior exam scores. For the TSDS dashboard tools, late enrollees are not included in the metric definition.
Drill Downs
Drill Down Views
The dashboards include the option to see more detail that is associated with a metric. Table 7 lists drill down views that are recommended for this metric.
| Grade Level | Graph of metric values by grade level | |
| Historical | Graph of metric values for multiple time periods | |
| Student List | List of students who do meet the threshold for this metric for the specified period. |
User Interface
Dashboard Example
Figure 2 shows the grade level chart for the Advanced Course Potential metric as seen on the campus dashboards.
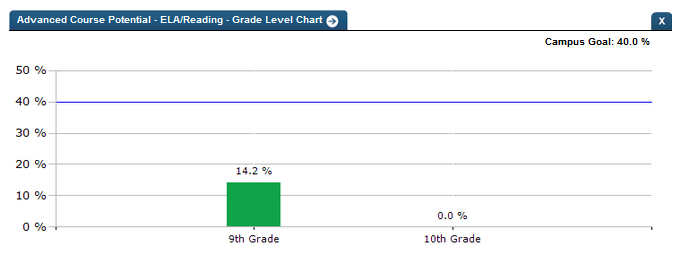
Figure 2 TSDS Advanced Course Potential Grade Level Chart
Figure 3 shows the historical chart for the Advanced Course Potential metric as seen on the campus dashboards.
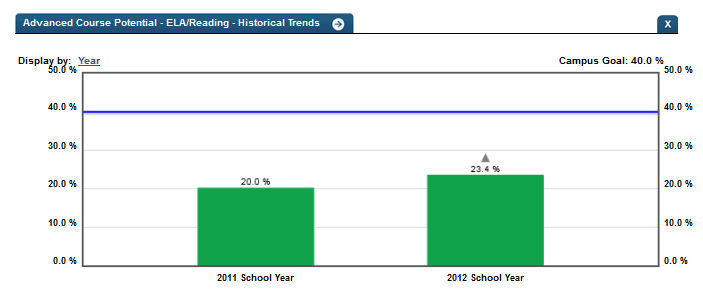
Figure 3 TSDS Advanced Course Potential Historical Chart
Drill down Tooltips
Grade Level Chart:
- The hover over on the bar of the graph will show the number of students who met the student goal of the total number of students considered for this metric.
- Green bar = met the campus goal
- Red bar = did not meet the campus goal
Historical Chart:
- The start and end dates and the percent value of the metric for that time period are shown as you hover over a bar of the graph.
- The hover over for the bar on the graph will show the number of student who met the student goal of the total number of students considered for this metric for the specified time period.
- Green bar = student did meet the student goal
- Red bar = student did not meet the student goal