Dashboard Metrics


Advanced Course Completion
Background
Campus Dashboard Metrics
Because of the importance of rigorous coursework to postsecondary success and to support district efforts to increase advanced course completion, several districts across the country, including Charlotte, Chicago, Dallas and Oakland, have incorporated into their internal performance management dashboards metrics to monitor advanced course enrollment and performance. In focus group discussions conducted with over 2,600 educators throughout Texas, 95% of those surveyed found advanced course enrollment and performance information useful when reported at the campus level. When reported at the student level, the percent of respondents finding the information useful was notably lower (less than 90%). The implication is that this metric, though still valuable to teachers in preparing their individual students for advanced coursework, may be even more useful to principals and counselors in developing strategic, school-wide approaches to increasing enrollment and success in advanced courses.
Primary Metric
- Advanced Course Completion: completion rate of students who were enrolled in at least one AP, IB or dual credit (DC) course in the four core subject areas during prior years, with comparison to campus goal.
User Interface
Dashboard Example
Figure 1 shows the Advanced Course Completion metric as seen on the campus dashboard.

Figure 1 TSDS Advanced Course Completion Metric
Status Definition
“Advanced courses” include AP courses, IB courses, other advanced courses identified by the course characteristic, and dual enrollment (also known as dual credit courses).
The Status column is the percentage of students that successfully completed (passed) at least one of their advanced courses in ELA, mathematics, science, and social studies in prior years.
The Status indicator is determined by campus-specific thresholds (campus goals) which are set at the district level. The TSDS default threshold is 75%.
Table 2 defines the Status indicators. The actual percentage is displayed with the indicator.
Metric Status Indicator | Comparisons | ||
Metric Name | Metric Status Indicator | Trend | Campus Goal (Delta) |
Advanced Course Completion | Red (Percentage) = if percentage of students completing at least one advanced course in the prior school year is less than the campus goal Green (Percentage) = if percentage of students completing at least one advanced course in the prior school year is greater than or equal to the campus goal | Current year to prior year | Campus goal and the calculated percentage of students completing at least advanced course in prior years |
(a) The Value column is the total number of students completing at least one advanced course out of the total number of students who took one or more advanced courses in prior years.
Trend Definition
Trend Indicators: Objective is to indicate Advanced Course Completion | |||
| Up green | If the value for the current time frame is more than 5 percentage points higher than the prior time frame, then display a gray arrow trending upward. | |
| Unchanged | If the value for the current time frame is less than or equal to 5 percentage points higher or less than or equal to 5 percentage points lower than the prior time frame, then display two gray arrows pointing outward indicating no direction. | |
| Down red | If the value for the current time frame is more than 5 percentage points lower than the prior time frame, then display a gray arrow trending downward. | |
The trend does not show for the first occurrence of a time frame since data is not available.
Delta Definition
The Delta column is the absolute value of the difference between the campus-wide percentage (Status column) and the campus goal (Campus Goal column).
Delta Indicators: Objective is to indicate Advance Course Completion | |||
Metric Name | Sub-Metric Name | Campus Goal | Delta |
Advanced Course Completion | not applicable | Set campus goal | Red (Delta Percentage) = if the calculated percentage of students completing at least one advanced course is less than the campus goal Black (Delta Percentage) = if the calculated percentage of students completing at least one advanced course is greater than or equal to the campus goal |
Periodicity
Recommended Load Characteristics | |
Calendar | Beginning and end of school year |
| Frequency of data load | Twice a year |
Latency | 7-8 months |
Interchange schema | Interchange-StudentGrades.xsd |
Tooltips
The standard tooltips for the metric definition, column headers, and help functions display for this metric.
- Green metric status: OK
- Red metric status: LOW
- 'More' indicates drill down views for this metric
 is ‘No change from the prior period'
 is ‘Getting worse from the prior period’
 is 'Getting better from the prior period'
Business Rules
The Advanced Course Completion metric is the percentage of current students in grades 10-12 that successfully completed (passed) at least one of their advanced courses in the prior year in the following subject areas:
- ELA/Reading
- Mathematics
- Science
- Social Studies
Completion of an advanced course is defined as earning a final grade greater than or equal to 70% for numeric grading systems, or greater than or equal to C for letter grading systems.
“Advanced courses” are those defined as follows:
- PreAP courses
- PreIB courses
- AP courses
- IB courses
- Other advanced courses identified by the course characteristic
- Dual enrollment (also known as Dual Credit courses)
Data Assumptions
- State- and locally-defined advanced courses in the core subjects are available.
Computed Values
The cohort is the set of currently enrolled students in grades 10-12 at the campus who took one or more advanced courses in the core subject areas in prior years.
Table 6 defines the calculation for the percentage of students passing at least one of their advanced courses in prior years. The results of the calculation display in the Status column.
Metric | Calculation |
Advanced Course Completion | (Total of all current students that took one or more advanced core courses in prior years) and (Completed at least one)) * 100 / (Total of all current students that took one or more advanced core courses in prior years) |
Data Anomalies
Data Anomalies
- High school campuses that only enroll 9th graders will not have data for this metric.
- Campuses that only serve a single grade level will be missing data for any metric that requires students be enrolled on the campus in the prior year, such as AP Completion.
- Advanced Placement Courses coded as Gifted and Talented or Honors only will not be included in this calculation.
- Advanced Placement results are often returned after 12th graders have graduated and are no longer enrolled on the campus. These students will not be included in the calculations.
- Advanced Course Enrollment may not be repeated until credit is earned or the first grading period has ended.
Date of Refresh
Best practice is for the date of last data refresh to appear next the metric in the following format:
- (Through Spring Semester 2010)
Implementation Considerations
Transfer Students (Late Enrollments)
Transfer students may not have complete transcripts from which to identify prior year advanced courses or mastery exams.
Advanced Course Definition
Best practice is for developers to ensure the definition of the exact courses that qualify as “advanced” include AP and IB courses, as well as those defined as advanced by both the state and locally defined by the district. This mapping looks at the course characteristic type as coded locally. In the case of courses that are both AP and another type such as GT, the course should have the characteristic type of AP. If the other characteristic is recorded, the course will not appear as 'advanced.'
Campus Goals
Best practice is for developers to set the goals for each campus at the district level. A secure mechanism is required to allow the district to set and maintain those goals.
Drill Downs
Drill Down Views
The dashboards include the option to see more detail that is associated with a metric. Table 7 lists the drill down views that are recommended for this metric.
| Grade Level | Graph of metric values by grade level. | |
| Historical | Graph of metric values across multiple time periods. | |
| Student List | List of students who do not meet the threshold for this metric for the specified period. |
User Interface
Dashboard Example
Figure 2 shows grade level chart for the Advanced Course Completion metric as seen on the campus dashboards.
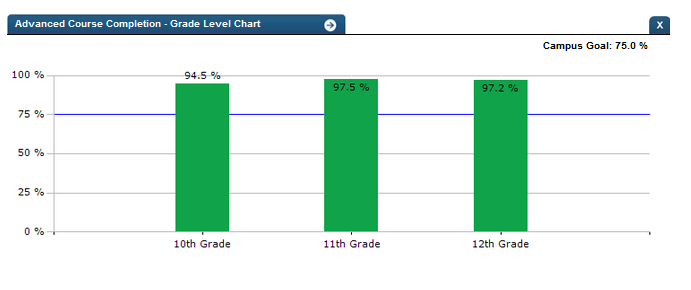
Figure 2 TSDS Advanced Course Completion Grade Level Chart
Figure 3 shows the historical chart for the Advanced Course Completion metric as seen on the campus dashboards.
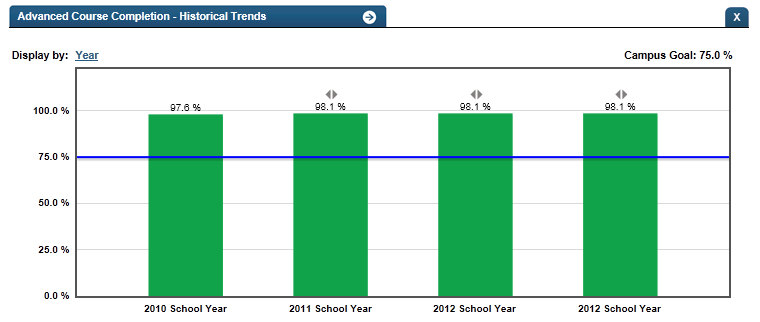
Figure 2 TSDS Advanced Course Completion Historical Chart
Drill down Tooltips
Grade Level Chart:
- The number of students who met the student goal out of the total number of students considered for this metric will display as you hover over the bars of the graph.
- Green bar = met the campus goal
- Red bar = did not meet the campus goal
Historical Chart:
- The start and end dates and the percent value of the metric for that time period are shown as you hover over a bar of the graph.
- Green bar = student did meet the student goal
- Red bar = student did not meet the student goal