Dashboard Metrics


PSAT
Background
Campus Dashboard Metrics
Because of the importance of college admission tests, many school districts across the nation, including Chicago, Charlotte, Dallas and New York, have incorporated metrics on PSAT/NMSQT® performance into their internal performance management dashboards. Moreover, the PSAT/NMSQT® is both a scholarship qualifying exam as well as a way to identify students with advanced course potential. In addition, during focus groups conducted with over 2,600 educators throughout Texas, the PSAT/NMSQT® Performance metric, as presented in screen shots of the student dashboard, was considered useful by 89% of those surveyed.
Primary Metric
- PSAT® Performance: percent of students who have taken the PSAT® at each grade level and whether or not they meet the threshold.
User Interface
Dashboard Example
Figure 1 shows the PSAT metric as seen on the campus dashboard.
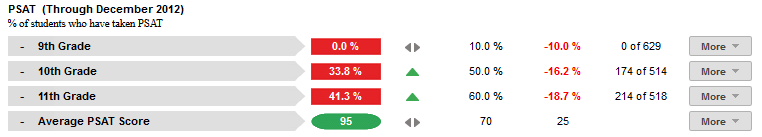
Figure 1 TSDS PSAT Metric
Status Definition
The Status indicator is determined by campus-specific thresholds (campus goals) which are set at the district level. The TSDS default thresholds are
- % Completing Exam = 60%
- Average PSAT Score = 80%
Metric Status Indicator | Comparisons | |||
Metric Name | Sub-metric Name | Metric Status Indicator | Trend | Campus Goal (Delta) |
PSAT | % Completing Exam | Red (Percentage) = If percentage of students completing the exam is less than the campus goal Green (Percentage) = If the percentage of students completing the exam is greater than or equal to the campus goal | Current year to prior year | The campus goal and the calculated percentage of students completing the exam |
Average PSAT Score | Red (Percentage) = If the calculated average score is less than the campus goal Green (Percentage) = if the calculated average score is greater than or equal to the campus goal | Current year to prior year | Campus goal and the calculated average score | |
(a) The Value column displayed the number of students who completed the PSAT out of the total number of students.
Trends
The objective of the trend indicator is to increase the percent of students taking college entrance exams.
Trend Indicators for College Entrances Exams | |||
| Up green | Percentage is higher compared to previous time frame; upward trend is favorable | |
| Unchanged | + 5 percentage points | |
| Down red | Percentage is lower compared to previous year; flag indicates unfavorable trend | |
Delta Definition
The Delta column is the absolute value of the difference between the campus percentage (Status column) and the campus goal (Goal column).
Delta Indicators: Objective is to indicate PSAT performance | |||
Metric Name | Sub-Metric Name | Campus Goal | Delta |
PSAT | % Completing the Exams and Average PSAT Score | Set campus goal | Red (Percentage) = if the calculated percentage of students completing the test is less than the campus goal Black (Percentage) = if the calculated percentage of the students completing the test is greater than or equal to the campus goal |
Periodicity
At a minimum, load the data for this metric at least annually, prior to the beginning of the school year. Best practice is to load the data monthly to capture the various test administrations. (PSAT exams are administered and received by districts several times throughout the year).
Recommended Load Characteristics | |
Calendar | Throughout the school year |
Frequency of data load | Monthly |
Latency | Yearly |
Interchange schema | Interchange-StudentAssessment.xsd |
Tooltips
The standard tool tips for the metric definition, column headers, and help functions display for this metric.
- Green metric status: OK
- Red metric status: LOW
- 'More' indicates drill down views for this metric
 is ‘No change from the prior period'
 is ‘Getting worse from the prior period’
 is 'Getting better from the prior period'
Business Rules
The cohort for this metric is students currently enrolled in grades 9 through 12 at the campus at the time of the last data load. Excluded from the cohort are students who
- were previously enrolled, but left or transferred to another campus
- do not match student data due to SSID
- do not have complete transcripts
Data Source
- PSAT data are made available to the districts periodically as the test is administered throughout the year.
- Data for this metric is aggregated from the student data provided by the districts.
- Exclude students from the cohort who are transfer students (late enrollees) without complete transcripts.
- Exclude students from the cohort who do not match student data due to SSID.
PSAT
The percentage of students completing a particular exam is computed based upon the following rules:
- "Completing the exam" means that a student was administered the exam and that the exam was scored.
- A student may take an exam multiple times, although only the most recent exam score is counted.
- An incomplete transcript for a transfer student that does not include results of a particular exam is not counted.
The average score is computed based on the following:
- PSAT combined score (Critical Reading Score + Mathematics Score + Writing Score)
Computed Values
Table 6 defines how values are calculated for each sub-metric. The result of the calculation displays in the Status column on the campus dashboard.
Metric Values | |
% Completing Exam | (Number of all current students who have taken the PSAT) * 100 / (Number of all current students across all grades in cohort) |
Average PSAT Score | (Total of all combined scores for those current students who have taken the PSAT) / (Number of students who have taken the exam) |
Data Anomalies
Anomalies
Best practice is to footnote these anomalies:
- Date of the last test assessments in the database displays parenthetically in the title of the metric.
- Late enrollees may have taken college readiness tests at their previous school.
- Transfer students with an incomplete transcript.
- Students cannot be matched due to SSID.
Footnotes
Footnotes are used to provide additional data information concerning the metric. Footnotes are sequential for the entire page. Therefore, a metric’s footnote may not begin with the number 1.
- The number of students not included in calculation due to transfer students with an incomplete transcript or students that cannot be matched due to SSID should be noted
Date of Refresh
Best practice is for the date of last data refresh to appear next the metric in the following format:
- (Through April 2010)
Implementation Considerations
Exam Apparent Non-Participation
The PSAT, SAT and ACT scores are administered throughout the year. Students’ non-participation can be detected only to the extent that the district has received and loaded timely test result data from The College Board (PSAT and SAT) and ACT. Information from one district’s coordinator indicate the SAT and ACT deliveries of results were “random” throughout the year. To make the Percentage Completing Exam indicator most effective, it is imperative that the scores be received and loaded in the timeliest manner.
Exam Participation Expectation
Students may take the College Preparatory exams anywhere from 9th through 12th grade and may take them multiple times. The PSAT is typically taken in 9th or 10th grade, whereas the SAT and ACT are typically taken in the 11th and 12th grade. Proper application of the metric requires that the district or campus establish clear expectations for when students should take the PSAT, SAT, and ACT, and if a student has not taken either assessment, at what point an intervention is in order.
This functionality includes displaying this metric by grade and/or limiting the metric cohort to those students in the 10th and 11th grade for PSAT and 11th and 12th grade for SAT and ACT.
Incomplete Transcripts and Missing Exam Scores
Transfer students may have incomplete transcripts that do not show prior PSAT participation. Timely acquisition of a transfer student’s transcript is imperative to apply this and other metrics.
Indicator and Metric Definitions
In researching best practices across leading districts, college readiness exams and measures were identified as a leading indicator of post-secondary acceptance and success. In addition to measuring the percentage of students who have taken the PSAT exam, and the percentage of students at or above the state criterion, other ways districts measure this indicator include:
- PSAT Performance: average PSAT score for the campus.
Drill Downs
Drill Down Views
The dashboards include the option to drill down and see more detail that is associated with a metric. Table 7 lists the drill down views that are recommended for this metric.
| Historical | Graph of metric values across multiple time periods. | |
| Student List | List of students who do not meet the threshold for this metric for the specified period. |
User Interface
Dashboarrd Examples
Figure 2 shows the historical chart for the PSAT metric as seen in the campus dashboards.
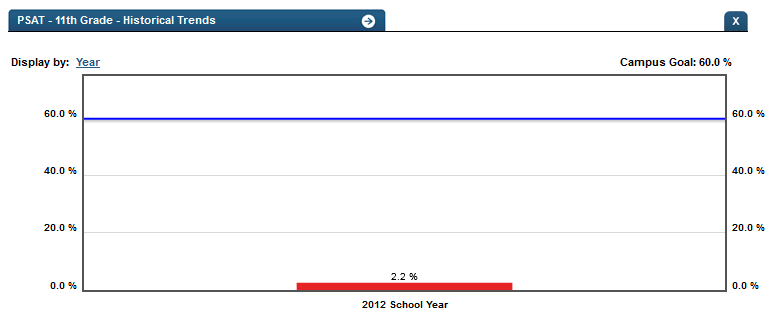
Figure 2 TSDS PSAT Historical Chart