Dashboard Metrics


Teacher Attendance Rate
Background
Campus Dashboard Metrics
Classroom teachers play a huge role in student achievement. Teacher attendance effects students achievement more than any other teacher metric. In addition, during focus groups conducted with over 2,600 educators throughout Texas, the Teacher Attendance metric, as presented in screen shots of the campus dashboard, was considered useful by 97% of those surveyed.
Primary Metric
Teacher Attendance: percentage of teachers meeting a minimum attendance threshold with trend comparisons.
User Interface
Dashboard Example
Figure 1 shows the Teacher Attendance Rate metric as seen on the staff dashboard.
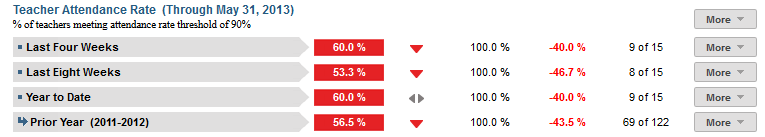
Figure 1 TSDS Teacher Attendance Rate Metric
Status Definition
The Status indicator is determined by campus-specific thresholds (campus goals) which are set at the district level. The TSDS default teacher attendance threshold for each time frame is 90%.
Table 2 lists the Status indicators and trend comparisons as seen on the staff dashboard.
Metric Indicator | Comparisons | |||
Metric Name | Sub-metric Name | Metric Status Indicator | Trend | Campus Goal (Delta) |
Teacher | Last Four Weeks | Red (Percentage) = If percentage of teachers meeting attendance rate is greater than or equal to campus goal Green (Percentage) = if percentage of teachers meeting attendance rate is less than campus goal | Current and prior four weeks (20 instructional days) | Campus goal and the calculated teacher attendance rate |
Last Eight Weeks | Red (Percentage) = If percentage of teachers meeting attendance rate is greater than or equal to campus goal Green (Percentage) = if percentage of teachers meeting attendance rate is less than campus goal | Current and prior eight weeks (40 instructional days) | Campus goal and the calculated teacher attendance rate | |
Year to Date | Red (Percentage) = If percentage of teachers meeting attendance rate is greater than or equal to campus goal Green (Percentage) = if percentage of teachers meeting attendance rate is less than campus goal | Current year to prior year | Campus goal and the calculated teacher attendance rate | |
a) The Value column displays the number of teachers in attendance out of the total number of teachers at campus during the time frame.
Trend Definition
Table 3 lists the trend indicators for the Teacher Attendance Rate metric.
Trend Indicators: Objective is to indicate the Teacher Attendance Rate | |||
| Up green | Percentage is higher compared to previous time frame; upward trend is favorable | |
| Unchanged | + 5 percentage points | |
| Down red | Percentage is lower compared to previous time frame; flag indicates unfavorable trend | |
Delta Definition
The Delta column is the absolute value of the difference between the campus attendance percentage (Status column) and the campus goal (Campus Goal column). If the attendance percentage is below the campus goal, the delta percentage is displayed in red. If the attendance percentage is equal to or above the campus goal, the delta percentage is shown in black.
Periodicity
Best practice is to upload the data for this metric at least monthly.
Recommended Load Characteristics | |
Calendar | Throughout the school year |
Frequency of data load | Monthly, yearly |
Latency | 4 weeks |
Interchange schema | Interchange-StaffAssociation.xsd |
Tooltips
The standard tool tips for the metric definition, column headers, and help functions display for this metric.
The following are tooltips specific to the Teacher Attendance Rate metric:
- Green metric status: OK
- Red metric status: LOW
- 'More' indicates drill down views for this metric
 is ‘No change from the prior period'
 is ‘Getting worse from the prior period’
 is 'Getting better from the prior period'
Business Rules
The Teacher Attendance Rate metric displays the percentage of teachers meeting the attendance rate threshold for the following time frames:
- Last Four Weeks
- Last Eight Weeks
- Year to Date
The teacher attendance rate metric is computed based upon a campus-specific business rule for teacher attendance data.
Data Assumptions
- Data that tracks teacher absences is available
- Absent days are available
- Reason for absence is available
Computed Values
The days a new teacher is not signed up to teach must be subtracted from the "number of work days" in the computation.
Table 5 defines how values are calculated for each sub-metric. The result of the calculation displays in the Status column on the campus dashboard.
Metric Values | ||
% of teachers meeting attendance rate threshold | Last Four Weeks | Days in Attendance = (Number of teacher work days in 20 academic days) – (Total number of teacher absences) *100 Percent of teachers meeting threshold = (Total number of teachers meeting threshold) / (Total number of teachers at campus) *100 |
Last Eight Weeks | Days in Attendance = (total number of teacher work days in 40 academic days) – (total number of teacher absences) *100 Percent of teachers meeting threshold = (Total number of teachers meeting threshold) / (Total number of teachers at campus) *100 | |
Year to Date | Days in Attendance = (total number of teacher work days in school year) – (total number of teacher absences in school year) * 100 Percent of teachers meeting threshold = (Total number of teachers meeting threshold) / (Total number of teachers at campus) *100 | |
Data Anomalies
Data Anomalies
- Metrics are sensitive to when and how often the data is loaded.
- New teachers are likely to be missing attendance. If data exists, adjust the denominator in the calculation to reflect eligible days.
- If the school calendar changes, adjust the denominator to reflect eligible days.
- If the last data load was more than a month ago, create an icon to display the date of the last load.
Date of Refresh
Best practice is for the date of last data refresh to appear next the metric in the following format:
- (Through April 2010)
Implementation Considerations
New Teachers
For new teachers, subtract the days the teacher is not signed up to teach from the number of work days in the time frame.
Classification of Days as Non-Work Days
For the computation of the number of work days, use the total count of work days in a period or utilize the school calendar to identify specific work days for the time frame as the denominator for the percentage. The latter is a more accurate approach to calculating the metric with the caveat that this requires frequent uploading of data throughout the school year.
Frequency of Uploading Data
The metric computation implementation may vary depending on the periodicity of loading the data. For example, a daily load deals only with loading a single day (i.e., the last instructional day). Less frequent uploads require loading of multiple days since the date of the last load.
Campus Goals
Best practice is to set the campus goals for each campus at the district level. A secure mechanism is required to allow the district to set and maintain those thresholds.
Drill Downs
Drill Down Views
The dashboards include the option to drill down and see more detail that is associated with a metric. Table 6 lists the drill down views that are recommended for this metric.
| Historical | Graph of historical absences by year | |
| Teacher List | List of teachers who do not meet the threshold for this metric for the specified period. |
User Interface
Dashboard Example
Figure 2 shows the historical chart for the Teacher Attendance Ratemetric as seen on the campus dashboards.

Figure 2 TSDS Historical Teacher Attendance Rate
Business Rules
The Historical Graph allows the user to see historical data across multiple timeframes. As time passes, there are many bars to be displayed; therefore, the slider on the bottom allows the user to adjust the number of bars displayed as well as the time period shown. The timeframes for this metric were chosen based on educator feedback.