Dashboard Metrics


Teacher Retention
Background
Campus Dashboard Metrics
Identifying and training effective teachers can be a very expensive and time consuming process. It is therefore advantageous for campuses and districts to retain effective teachers. Moreover, in focus groups with over 2,600 Texas educators, the Teacher Retention metric was seen as useful by 89% of educators.
Primary Metric
- Teacher Retention: percentage of teachers returning from the previous year.
User Interface
Dashboard Example
Figure 1 shows the Teacher Retention Rate metric as seen on the staff dashboard.

Figure 1 TSDS Teacher Retention Rate
Status Definition
The status indicator is determined by campus specific goals which are set at the district level. The TSDS default goal = 80%
Table 2 shows the status indicators for the teacher retention metric.
Metric Indicator | Comparisons | ||
Metric Name | Metric Indicator | Trend | Campus Goal (Delta) |
Teacher Retention | Red (Percentage) = fewer teachers returning from prior year than campus goal Green (Percentage) = percentage of teachers returning from the previous year is equal to or greater than campus goal | Current and prior year | Campus goal and the calculated Teacher retention |
Trend Definition
Table 3 lists the trend indicators for the Teacher Education metric. .
Trend Indicators for Teacher Education | |||
| Up green | Percentage is higher compared to previous time frame; upward trend is favorable | |
| Unchanged | + 5 percentage points | |
| Down red | Percentage is lower compared to previous time frame; flag indicates unfavorable trend | |
Delta Definition
The Delta column is the absolute value of the difference between the campus retention percentage (Status column) and the campus goal (Campus Goal column). If the retention percentage is below the campus goal, the delta percentage is displayed in red. If the retention percentage is equal to or above the campus goal, the delta percentage is displayed in black.
Periodicity
Best practice is to load the data for this metric each semester.
Recommended Load Characteristics | |
Calendar | Throughout the school year |
Frequency of data load | Yearly |
Latency | Year |
Interchange schema | Interchange-StaffAssociation.xsd |
Tooltips
The standard tool tips for the metric definition, column headers, and help functions display for this metric.
The following are tooltips specific to the Teacher Education metric:
- Green metric status: OK
- Red metric status: LOW
- 'More' indicates drill down views for this metric
 is ‘No change from the prior period'
 is ‘Getting worse from the prior period’
 is 'Getting better from the prior period'
Business Rules
The Teacher Retention metric displays the percentage of teachers returning to that campus from the previous year.
Data Assumptions
- Data is available in district source systems.
- Teacher IDs and other identifying information is consistent from year to year.
Computed Values
Table 5 defines how values are calculated for the metric. The result of the calculation displays in the Status column on the staff dashboard.
Metric Values | |
Teacher Retention | Total number of teachers on the campus currently who were on the campus in the prior year/the total number of teachers on the campus in the prior year |
Data Anomalies
Data Anomalies
- Changes in identifying information, including teacher's name and ID, may prevent correct comparisons through this metric.
- Changes in the structure of a campus (addition of a grade, program) that would greatly increase or decrease the number of teachers on a campus from year-to-year could make the metric appear incorrect.
Date of Refresh
No date of refresh is needed for this metric.
Drill Downs
Drill Down Views
The dashboards include the option to drill down and see more detail that is associated with a metric. Table 6 lists the drill down views that are defined for this metric.
| Historical | Historical metric values across multiple time periods. | |
| Teacher List | List of teachers who do not meet the threshold for this metric for the specified period. |
User Interface
Dashboard Example
Figure 2 shows the Teacher List for the Teacher Retention metric as seen in the operational dashboard.
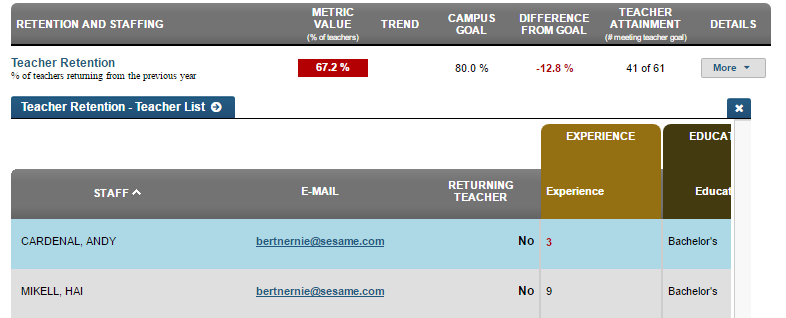
Figure 3 TSDS Teacher Retention List
Figure 3 shows the historical chart for the Teacher Retention metric as seen in the operational dashboard.
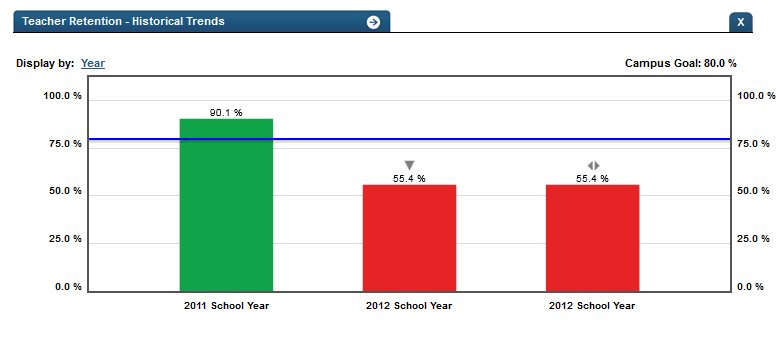
Figure 3 TSDS Teacher Retention Historical Chart