Dashboard Metrics


Credit Accumulation
Background
Student Dashboard Metrics
In order to monitor student progress toward completion of graduation requirements, many school districts across the nation, including Chicago, Dallas and New York, have incorporated metrics on credit accumulation into their internal performance management dashboards. In addition, during focus groups conducted with over 2,600 educators throughout Texas, the Credit Accumulation metric, as presented in screen shots of the student dashboard, was considered useful by 95% of those surveyed.
Primary Metric
- Credit Accumulation: cumulative number of credits earned as of the prior grading period compared to minimum credits required at mid-year and at the end of each year under the default state graduation plan (Recommended or Foundation with Endorsements).
User Interface
Dashboard Example
Figure 1 shows the Credit Accumulation metric as seen on the student dashboard.
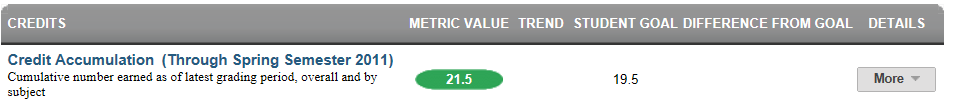
Figure 1 TSDS Credit Accumulation Metric
Status Definition
The Status Indicator is determined by whether the student is at, above, or below a linear path for meeting the recommended minimum number of credits for graduation.
The default threshold set in the TSDS dashboards is based on the graduation plan requirements set by the state of Texas (Recommended graduation plan requires 26 credits). The default mechanism to track credits by grade uses a linear path for the four years of high school (9-12), which assumes accumulating 6.5 credit hours per year. The credit thresholds to graduate and for each year can be adjusted to a particular district and/or state criteria.
| Metric Status Indicator | Trends Comparisons | |||
Metric Name | Sub-metric Name | Metric Status Indicator | From | To |
Credit Accumulation | not applicable | Red (BELOW) = if the student's total credit accumulation is less than the target number for the current grade level Green (ON TRACK) = if the student's total credit accumulation is greater than or equal to the target number for the current grade level | N/A | N/A |
(a) The Value column displays the total number of credits earned as of the last grading period.
Trends
The dashboards do not currently support trends for this metric.
Periodicity
Best practice is to load the data for this metric as soon as a semester grading period ends and transcript information is updated. At minimum, load this information at the beginning of a school year to assess any scheduling and/or targeted intervention required.
Recommended Load Characteristic s | |
Calendar | Throughout the school year |
Frequency of data load | End of each grading period |
Latency | Grading period |
Interchange schema | Interchange-StudentGrade.xsd |
Tooltips
The standard tool tips for the metric definition, column headers, and help functions display for this metric.
- Green metric status: OK
- Red metric status: BELOW
- 'More' indicates drill down views for this metricr
Business Rules
The Credit Accumulation metric indicates whether the student is at, above, or below a linear path for meeting the number of credits for graduation.
- At the start of the school year, a student is "on track" if their total number of credits is at or above the targeted number of credits for the year. Table 4 lists the targeted number of credits for each year by grade level.
Student’s | Yearly Recommended Credits | Percent of Target |
|---|---|---|
9 | not applicable | not applicable |
10 | 6.5 | 25% |
11 | 13 | 50% |
12 | 19.5 | 75% |
- After mid-year first semester grade data is loaded, a student is "on track" if their total number of credits is at or above the targeted number of credits for mid-year. Table 5 lists the targeted number of credits for mid-year by grade level.
Student’s | Mid-Year Recommended Credits | Percent of Target |
|---|---|---|
9 | not applicable | not applicable |
10 | 9.5 | 37% |
11 | 16 | 62% |
12 | 22.5 | 87% |
On a straight linear basis the mid-year semester student needs to earn 3.25 credits. Because a student can only earn credits in 0.5 increments, the target is rounded down to 3 credits.
For students who fail a class, the credit is not earned or counted. If the student repeats the class and passes, the credit is earned and counted.
If a student is missing a transcript or has a partial transcript, that student is not included in the student's cohort.
If the middle school campuses send the transcripts for high school credits earned, these credits are considered in this metric.
Data Assumptions
- This metric is not available for students currently in the 9th grade.
- The student’s transcript must reflect the current credits earned.
- The credit targets are set based upon the state’s graduation requirements.
- The metric tracks to a linear accumulation of credits.
- Any course that is included in a student transcript is included in the calculation for credits earned.
Computed Values
The yearly targets for accumulated credits are:
- 10th grade: 25% of the credits to graduate
- 11th grade: 50% of the credits to graduate
- 12th grade: 75% of the credits to graduate
The semester targets for accumulated credits are:
- 10th grade: 37% of the credits to graduate
- 11th grade: 62% of the credits to graduate
- 12th grade: 87% of the credits to graduate
Table 6 defines how values are calculated for each grade level. The result of the calculation displays in the Status column on the campus dashboard.
Metric Values | |
For each grade level | Total number of earned credits / Total number of credits required to graduate |
Data Anomalies
Anomalies
Best practice is to use footnotes to address these anomalies:
- Loading of data from each semester period
- Late enrollees may not have previous grading period grades from another school
- Missing transcripts for transfer students
- Learning ISD (example site) contains incomplete transcript information which may result in lower than expected credits for students.
Footnotes
Footnotes are used to provide addition data information concerning the metric. Footnotes are sequential for the entire page. Therefore, a metric's footnote may not begin with the number 1.
The following footnotes appear below the metric:
- Late enrollee students that have not been present for a full grading period should be noted by a designated icon
- Missing transcripts for transfer students
Date of Refresh
Best practice is for the date of last data refresh to appear next the metric in the following format:
- (Through Spring Semester 2010)
Implementation Considerations
Incomplete Transcript
Students who transferred in may have an incomplete transcript pending when their student record is received by their current campus and a business rule should be established to flag these cases. It should be noted in some fashion when the accumulated credits are not accurate because of an incomplete transcript.
Targets for Accumulated Credits
The targets for accumulated credits are based upon state-defined credit requirements for graduation. The metric assumes that a student will earn a certain number of credits over regular intervals during his or her high school career.
Inclusion of Credits
TSDS assumes that any credit type included in a transcript (e.g., standard, recovery, credits by exam, on-line) is to be included in the metric calculation. If any exceptions are relevant, these need to be accounted for in the metric calculation and assumptions.
Drill Downs
Description
The Historical Drill Down displays a chart of cumulative credits versus linear goals for one or more types of graduation plan. The historical drill down is grayed out if the student is currently in the 9th grade.
Drill Down Views
The dashboards include the option to drill down and see more detail that is associated with a metric. Table 7 lists the drill down views that are recommended for this metric.
Course History | Link to course history, grades and credits earned | |
Historical Chart | A graph displaying the student's earned credits at each grade level compared to the targeted credits for each grade level for the student's graduation plan |
User Interface Notes
Figure 2 shows the course history for the Credit Accumulation metric as seen on the student dashboard.
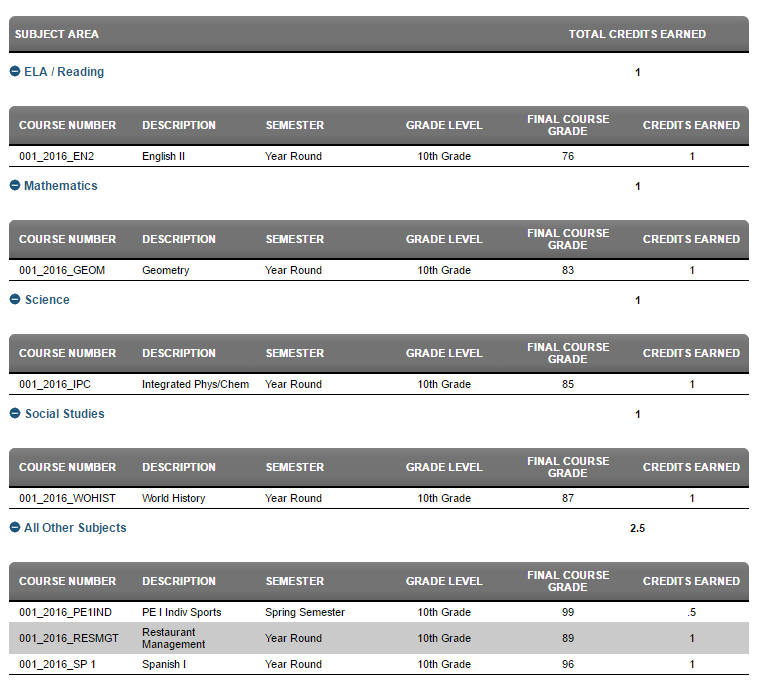
Figure 2 TSDS Credit Accumulation Course History
Figure 3 shows the historical chart for the Credit Accumulation metric as seen on the student dashboard.
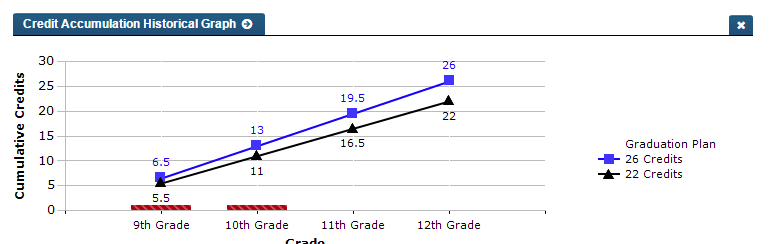
Figure 3 TSDS Credit Accumulation Historical Graph Detail
Drill Down Tooltips
- The number of credits accumulated by the student is shown when an educator hovers over a specific grade’s bar, as shown in Figure 2.
Drill Down Footnotes
- In cases where a student has incomplete or missing transcript data, credit shortfalls are likely.
- Data should be updated every semester
Business Rules
The Credit Accumulation Historical Graph shows the following elements:
- For each grade completed by the student, the number of credits accumulated at completion of that semester or final grade.
- The hover over on the bars of the graph displays the number of credits earned for that year.
- For each type of graduation plan, the linear target set of credits for each year, assuming 25% per year for grades 9-12.
- a bar chart of actual cumulative credits per grade per year
- line graph of state-defined thresholds of credit targets for graduation, as shown in Table 8.
Grade Level | Recommended Yearly Credits | Minimum Yearly Credits |
|---|---|---|
9 | 6.5 | 5.5 |
10 | 13 | 11 |
11 | 19.5 | 16.5 |
12 | 26 | 22 |
If the student has cumulative credits
- greater than or equal to the recommended credits, the bar chart displays in green.
- less than or equal to the recommended credits, the bar chart displays in red.
The default graduation plans plotted reflect the following Texas state-mandated credits:
- The Recommended and Distinguished plans (High School Graduation Plan) or Foundation with Endorsements and Distinguished plans (Foundation High School Program) require 26 credits for graduation
- The Minimum Plan (High School Graduation Plan) or Foundation (Foundation High School Program) requires 22 credits for graduation
Data Assumptions
- This view is not available for students currently in the 9th grade.