Dashboard Metrics


PSAT
Background
Student Dashboard Metrics
Because of the importance of college admission tests, many school districts across the nation, including Chicago, Charlotte, Dallas and New York, have incorporated metrics on PSAT/NMSQT® performance into their internal performance management dashboards. Moreover, the PSAT/NMSQT® is both a scholarship qualifying exam as well as a way to identify students with advanced course potential. In addition, during focus groups conducted with over 2,600 educators throughout Texas, the PSAT/NMSQT® Performance metric, as presented in screen shots of the student dashboard, was considered useful by 89% of those surveyed.
Primary Metric
- PSAT® Performance: whether or not the student has taken the Preliminary SAT and the student’s score.
User Interface
Dashboard Example
Figure 1 shows the College Entrance Exams metric as seen on the student dashboard.
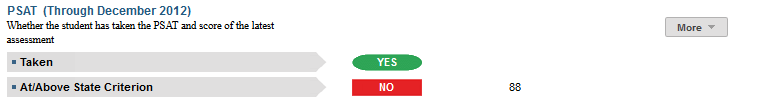
Figure 1 TSDS College Entrance Exams PSAT
Status Definition
This metric provides information regarding the PSAT assessment.
The value displayed for the at/above state criterion is the Selection Index Score.
Metric Indicator | Trend Comparisons | |||
Metric Name | Sub-metric Name | Metric Status Indicator | Compares: | To: |
PSAT | Taken | Red (No) = Not taken or if grade level is greater than 10 and fall administration date has passed N/A = no score exists and grade level is lower than 10th Green (Yes) = score exists | N/A | N/A |
At/Above State Criterion | Red (No) = If critical reading, mathematics, or writing value is less than 80% Green (Yes) = If critical reading, mathematics AND writing score is greater than 80% | N/A | N/A | |
Trends
Trends are not calculated for this metric.
Periodicity
Best practice is to upload the data for this metric at least annually prior to the beginning of the school year. Given that PSAT, SAT, and ACT tests are administered and received by districts several times throughout the year, upload the data monthly to capture the various test administrations (e.g., SAT and ACT exams are administered nearly every month and PSAT scores are available at the end of the calendar year).
Recommended Load Characteristics | |
Calendar | Throughout the school year |
Frequency of data load | Monthly |
Latency | Yearly |
Interchange schema | Interchange-StudentAssessment.xsd |
Tooltips
The standard tool tips for the metric definition, column headers, and help functions display for this metric.
The following are tooltips specific to the metric:
- Green metric status: YES
- Red metric status: NO
- 'More' indicates drill down views for this metric
Business Rules
Data Assumptions
- PSAT scores are made available to districts once each year in December. Data must be available to be loaded into the dashboards.
- Best practice is to footnote transfer students (late enrollment) who do not have complete transcripts.
Computed Values
Table 4 defines how values are calculated for this metric. The result of the calculation displays in the Status column on the student dashboard.
Metric Values | ||
PSAT | Taken | Student PSAT reading score + student PSAT mathematics score |
At/Above State Criterion | PSAT score is greater than 80% | |
Data Anomalies
Anomalies
Best practice is to footnote these anomalies:
- Late enrollees may have taken college readiness tests at their previous school
- Loading of data from multiple administration dates
- SAT does not have social security number
Implementation Considerations
Student Identity
Assessment results files must include valid student TSDS UIDs in order for the data to load properly. If PSAT metrics do not load correctly, please ensure that the UIDs in the source file are correct.
PSAT/SAT/ACT Apparent Non-Participation
The SAT and ACT scores are administered throughout the year. Students’ non-participation can only be detected to the extent that the district has received and loaded timely test result data from SAT and ACT. Information from one district’s coordinator indicated the SAT and ACT deliveries of results were “random” throughout the year. To make the Taken indicator most effective, it is imperative that the SAT and ACT scores be received and loaded in the most timely manner.
PSAT/SAT/ACT Participation Expectation
Students may take the SAT and ACT anywhere from 9th through 12th grade and may take them multiple times. For example, in the TSDS dashboard, a red status indicator displays at the 11th and 12th grade levels. Proper application of the metric requires the district or campus establish clear expectations for when students should take the SAT/ACT, and if a student has not taken either assessment, at what point an intervention is in order.
Drill Downs
Description
The PSAT/SAT/ACT metric contains drill downs to provide more insight on the historical test performance and objective and item level performance within each subject tested. The drill down is accessed by the "+More" hyperlink.
Drill Down Views
This metric includes the option to drill down for information that is associated with this metric. Table 5 lists the drill down views that are defined for this metric.
PSAT Score | The detail view shows the individual PSAT scores for all of the dates that the student has taken the test and if the scores met state criteria. |
The objective is to provide a measure of college readiness progress for students.
User Interface
Dashboard Description
Figure 2 shows the score detail for the PSAT metric as seen on the student dashboard.
Figure 2 TSDS PSAT score detail