Dashboard Metrics


ACT
Background
Student Dashboard Metrics
Because of the importance of college admission tests, many school districts across the nation, including Chicago, Charlotte, Dallas and New York, have incorporated metrics on ACT® performance into their internal performance management dashboards. In addition, during focus groups conducted with over 2,600 educators throughout Texas, the ACT® Performance metric, as presented in screen shots of the student dashboard, was considered useful by 94% of those surveyed.
Primary Metric
- ACT® Performance: reports whether or not a student has taken the ACT® and if they have scored at or above the specified state criterion.
User Interface
Dashboard Example
Figure 1 shows the College Entrance Exams metric as seen on the student dashboard.
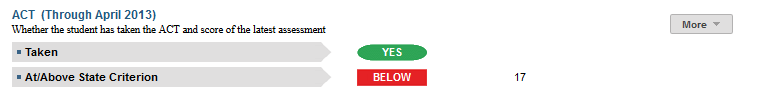
Figure 1 TSDS College Entrance Exams ACT
Status Definition on the Dashboards
This metric provides information regarding the ACT assessment tests.
The value displayed for the at/above state criterion is the student's composite score.
| Metric Indicators | Trend Comparisons | |||
| Metric Name | Sub-metric Name | Metric Status Indicator (a) | Compares: | To: |
ACT | Taken | Red (No) = if grade level is 11th and assessment score for ACT does not exist Green (Yes) = if score exists No status = if student grade level is 9th or 10th and no score exists | N/A | N/A |
At/Above State Criterion | Red (Below) = if composite score is less than 24 Green (At Goal) = if composite score is greater than or equal to 24 | Current Year | Prior Year | |
Trends
The trend indicator only applies to the At/Above Criterion metric.
Trend Indicators: Objective is to indicate College Entrance Exam Metric | |||
| Up green | If the composite score for the most recent administration is more than 1 point higher than the prior administration. | |
| Unchanged | If the composite score for the most recent administration is the same as the prior administration. | |
| Down red | If the composite score for the most recent administration is more than 1 point lower than the prior administration. | |


Periodicity
Best practice is to upload the data for this metric at least annually prior to the beginning of the school year. Given that ACT tests are administered and received by districts several times throughout the year, upload the data monthly to capture the various test administrations.
Recommended Load Characteristics | |
Calendar | Throughout the school year |
Frequency of data load | Monthly |
Latency | Yearly |
Interchange schema | Interchange-StudentAssessment.xsd |
Tooltips
The standard tool tips for the metric definition, column headers, and help functions display for this metric.
The following are tooltips specific to the metric:
- Metric tooltip for 'Taken' displays "Student has taken at least one ACT" when hovered.
- Metric tooltip for 'At/Above State Criterion' displays "Composite score at or above 24"
- Green metric status: YES
- Red metric status: BELOW
- 'More' indicates drill down views for this metric
Business Rules
Data Assumptions
- ACT scores are made available to the districts periodically as they are administered throughout the year.
- Composite scores are based on the scale score value provided by the vendor.
- Best practice is to indicate transfer students (late enrollment) who do not have complete transcripts.
Computed Values
Table 4 defines how values are calculated for this metric. The result of the calculation displays in the Status column on the student dashboard.
Metric Values | ||
ACT | Taken | Student participated in at least one administration and received a composite score (scale score). |
At/Above State Criterion | Student's composite score is greater than or equal to the state criterion as entered on a yearly basis (24). The student's composite score should display as the metric value. | |
Data Anomalies
Anomalies
Best practice is to footnote these anomalies:
- Late enrollees may have taken college readiness tests at their previous school
- Loading of data from multiple administration dates
Implementation Considerations
Student Identity
Assessment results files must include valid student TSDS UIDs in order for the data to load properly. If ACT metrics do not load correctly, please ensure that the UIDs in the source file are correct.
PSAT/SAT/ACT Apparent Non-Participation
The SAT and ACT scores are administered throughout the year. Students’ non-participation can only be detected to the extent that the district has received and loaded timely test result data from SAT and ACT. Information from one district’s coordinator indicated the SAT and ACT deliveries of results were “random” throughout the year. To make the Taken indicator most effective, it is imperative that the SAT and ACT scores be received and loaded in the most timely manner.
PSAT/SAT/ACT Participation Expectation
Students may take the SAT and ACT anywhere from 9th through 12th grade and may take them multiple times. For example, in the TSDS dashboard, a red status indicator displays at the 11th and 12th grade levels. Proper application of the metric requires the district or campus establish clear expectations for when students should take the SAT/ACT, and if a student has not taken either assessment, at what point an intervention is in order.
Incomplete Transcripts and Missing SAT/ACT Scores
Transfer students may have incomplete transcripts that do not show prior SAT or ACT participation. Timely acquisition of a transfer student’s transcript is imperative to apply this and other metrics.
Drill Downs
Description
The ACT metric contains drill downs to provide more insight on the historical test performance and objective and item level performance within each subject tested. The drill down is accessed by the "More" button.
Drill Down View
This metric includes the option to drill down for information that is associated with this metric. Table 5 lists the drill down views that are defined for this metric.
ACT Scores | The detail view shows a row for each of the Composite, English, and Math ACT scores for all of the dates that the student has taken the tests. The detail view also provides a column that compares the Composite score to the State Criterion. State Criterion for English and Math should display N/A. |
The objective is to provide a measure of college readiness progress for students.
User Interface Notes
Dashboard Example
Figure 2 shows the score detail for the ACT metric as seen on the student dashboard.
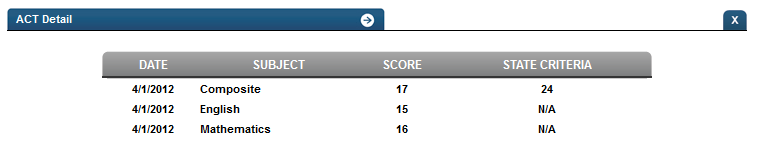
Figure 2 ACT Score Detail