Dashboard Metrics


Benchmark Assessments
Background
Student Dashboard Metrics
Benchmark assessments (curriculum-referenced tests) are assessments administered periodically throughout the school year, at specified times during a curriculum sequence, to evaluate students’ knowledge and skills relative to an explicit set of longer-term learning goals. The design and choice of benchmark assessments is driven by the purpose, intended users and uses of the instruments. Benchmark assessment can inform policy, instructional planning and decision-making at the classroom, school and district levels.
Primary Metric
- Benchmark Assessment Mastery: a student's score on a benchmark test and whether or not it meets the campus goal.
User Interface
Dashboard Example
Figure 1 shows the Student Benchmark Assessment metric as seen on the student dashboard.
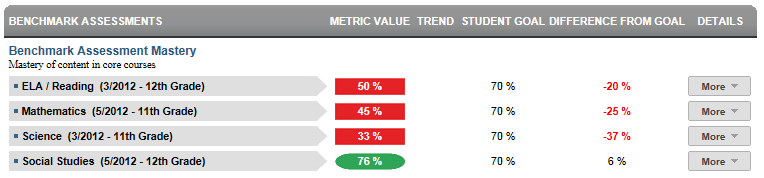
Figure 1 TSDS Benchmark Assessment Mastery Metric
Status Definition
The Status Indicator is determined by campus-specific thresholds (campus goals) which are set at the district level. The default threshold for each core subject is 70%.
Metric Indicator | Trend Comparisons | |||
Metric Name | Sub-metric Name | Metric Status Indicator | Compares: | To: |
Benchmark Assessment Mastery | ELA/Reading | Red (Below) = if student assessment score percentage is less than campus goal Green (Above) = if student assessment score percentage is greater than or equal to campus goal | Current assessment score | Previous assessment score |
Mathematics | Red (Below) = if student assessment score percentage is less than campus goal Green (Above) = if student assessment score percentage is greater than or equal to campus goal | Current assessment score | Previous assessment score | |
| Science | Red (Below) = if student assessment score percentage is less than campus goal Green (Above) = if student assessment score percentage is greater than or equal to campus goal | Current assessment score | Previous assessment score | |
Social Studies | Red (Below) = if student assessment score percentage is less than campus goal Green (Above) = if student assessment score percentage is greater than or equal to campus goal | Current assessment score | Previous assessment score | |
(a) The Value column displays the percentage of TEKS the student mastered out of the total number tested.
(b) The trends do not display if prior-year benchmark assessment data does not exist.
Trends
Currently the dashboards do not support trends for this district metric. The UI supports trends, but the ETL packages have not been developed.
Trend Definition
Table 3 lists the trend indicators for the Benchmark Assessment Mastery metric.
The trend does not display if the student has not taken a previous benchmark assessment.
Trend Indicators: Objective is to indicate Benchmark Assessment Mastery | |||
| Up green | If the value for the current period is more than 5 percentage points higher than the prior period | |
| Unchanged | If the value for the current period is less than or equal to 5 percentage points higher or less than or equal to 5 percentage points lower than the prior time frame | |
| Down red | If the value for the current period is more than 5 percentage points lower than the prior period | |
Delta Definition
Delta Indicators: Objective is to indicate Benchmark Assessment Mastery | |||
Metric Name | Sub-Metric Name | Student Goal | Delta |
Benchmark Assessment Mastery | ELA/Reading | Set Student Goal | Red (Percentage) = if the calculated delta is less than the campus goal Black (Percentage) = if the calculated delta is equal to or greater than the campus goal |
| Mathematics | Set Student Goal | Red (Percentage) = if the calculated delta is less than the campus goal Black (Percentage) = if the calculated delta is equal to or greater than the campus goal | |
| Science | Set Student Goal | Red (Percentage) = if the calculated delta is less than the campus goal Black (Percentage) = if the calculated delta is equal to or greater than the campus goal | |
| Social Studies | Set Student goal | Red (Percentage) = if the calculated delta is less than the campus goal Black (Percentage) = if the calculated delta is equal to or greater than the campus goal | |
Periodicity
Recommended Load Characteristics | |
Calendar | Throughout the school year |
Frequency of data load | Beginning and end of year |
Latency | 4 weeks |
Interchange schema | Interchange-StudentAssessment.xsd |
Tooltip
The standard tooltips for the metric definition, column headers, and help functions display for this metric.
The following tooltips are specific to the Benchmark metric:
- Green metric status: OK
- Red metric status: BELOW
 is ‘No change from the prior period'
 is ‘Getting worse from the prior period’
 is 'Getting better from the prior period'
Business Rules
All assessment data is displayed by the specific subject area:
- Elementary subjects: reading, writing, mathematics, science and social studies
- Middle school subjects: reading, writing, mathematics, science and social studies plus high school subjects that are tested at middle level (e.g., Algebra I, English I)
- High School subjects: Algebra I, Geometry
Data Source Requirements
- Benchmark assessments are made available to the districts periodically as they are administered throughout the year.
- Transfer students (late enrollment) who do not have complete transcripts should be indicated.
- State criteria differs by state and by year. Developers have the option to adjust the thresholds to fit specific organizational criteria.
Calculated Values
Table 5 defines how values for each subject are calculated. The result of the calculation displays in the Value column.
| Metric | Calculation |
Benchmark Assessment Mastery | Percentage = (Total number of TEKS mastered for the subject) / (Total number of all TEKS tested for the subject) * 100 |
Data Anomalies
Anomalies
- Metrics are sensitive to when and how often the data is loaded. Benchmarks are run after testing windows, grading periods, or other designated interval.
- Late enrollees are likely to be missing previous assessment data.
- Loading of data from multiple administration dates.
- Dashboards only display current year information at the student level.
- Campus rollups include historical information from prior years when available.
- The most recent exam displays in the classroom assessment detail view of benchmark performance.
- Teachers viewing a section with more than one grade level or students that were tested on different TEKS will scroll to the right to see the next set of TEKS for students that took a different exam.
Best practice is to use footnotes to address these anomalies.
Footnotes
Footnotes are used to provide additional information concerning the metric. Footnotes are sequential for the entire page. Therefore, a metric's footnote may not begin with the number 1.
The following footnotes appear below the metric:
- Students who have retaken the benchmark
- Transfer students with an incomplete transcript
Date of Refresh
Best practice is for the date of last data refresh to appear next the metric in the following format:
- (2/2011 - 5th grade) - for each subject area
Implementation Considerations
Non-Participation
Students who are scheduled to take an assessment, but are absent or exempt are reported in the assessment results files, along with the reason (e.g., absent, exempt for specific reason, etc.). Best practice is for developers to flag or footnote absent and exempt students in some manner.
Tying Test Results to Curriculum Standards
Interest has been expressed in having a next-level drill down from objectives to the student expectations level, which tie to the TEKS curriculum standards. This requires a separate file of data and mapping of assessment items to student expectation. This data is not available until after the last TAKS administration for the year and must be specially obtained from the test provider (Pearson).
Benchmark Assessment Identification
This metric requires districts or local assessment vendors to identify the following components from the enumerated set of data: test type, grade level, subject, classroom/section, campus, date of administration.
Drill Downs
Drill Down View
The dashboards include the option to drill down and see more detail that is associated with a metric. Table 6 lists the drill down views that are recommended for this metric.
| Historical Chart | Graph of historical performance |
Description
The Benchmark Assessment detail drill down displays the benchmark examinations taken, associated comprehensive score and current year.
User Interface Notes
Dashboard Example
Figure 2 shows the Historical Chart for Benchmark Assessment Mastery metric
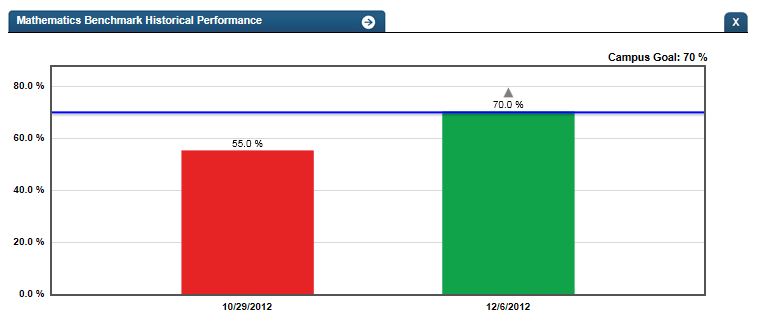
Figure 2 TSDS Historical Benchmark
Drill Down Tooltips
- The percentage of TEKS mastered is shown as you hover over a specific time frame bar of the graph as shown in Figure 2.
Business Rules
The benchmark assessment score detail displays the most recent score by administration date (within the current school year) grouped by subject area.
Historical Chart:
- The date of administration and the benchmark assesssment subject are shown as you hover over a bar of the graph.
- A grey arrow above the percent correct indicates the direction of trend for that subject area
- Green bar = student did meet the student goal
- Red bar = student did not meet the student goal